World Bank API in Python#
by Avery Fernandez and Michael T. Moen
NOTE: We currently plan to rewrite this tutorial with more relevant examples.
The World Bank offers a suite of APIs providing access to a vast array of global development data, including economic indicators, project information, and more. These APIs enable users to programmatically retrieve data for analysis, application development, and research purposes.
Please see the following resources for more information on API usage:
Documentation
Terms
Data Reuse
These recipe examples were tested on September 5, 2025.
Setup#
Import Libraries#
The following external libraries need to be installed into your environment to run the code examples in this tutorial:
We import the libraries used in this tutorial below:
import requests
import matplotlib.pyplot as plt
from time import sleep
DataBank Bulk Download#
The World Bank offers bulk downloads of specific datasets from DataBank Bulk Download or DataBank Bulk Microdata Download. If you require extensive or complete data, consider using these bulk downloads. For smaller requests or interactive analysis, the standard API calls work well.
1. Get Two-Letter Codes for Every Country#
The International Organization for Standardization (ISO) maintains a list of two-letter country codes (e.g. CA for Canada, DE for Germany, US for the United States of America). This standard is known as ISO 3166-1 alpha-2. These codes are vital for accessing data from specific countries using the World Bank API. These codes are referred to as iso2Code in the API.
To begin, we retrieve the iso2Code from every available country in the World Bank API.
BASE_URL = "http://api.worldbank.org/v2/country"
params = {
    "format": "json",
    "per_page": 500,
}
response = requests.get(BASE_URL, params=params)

# Status code 200 indicates success
response
<Response [200]>
# Extract data from response and find number of countries
country_data = response.json()[1]
print(f"Found {len(country_data)} countries")
Found 296 countries
# Print data from the first result (Aruba)
country_data[0]
{'id': 'ABW',
 'iso2Code': 'AW',
 'name': 'Aruba',
 'region': {'id': 'LCN',
  'iso2code': 'ZJ',
  'value': 'Latin America & Caribbean '},
 'adminregion': {'id': '', 'iso2code': '', 'value': ''},
 'incomeLevel': {'id': 'HIC', 'iso2code': 'XD', 'value': 'High income'},
 'lendingType': {'id': 'LNX', 'iso2code': 'XX', 'value': 'Not classified'},
 'capitalCity': 'Oranjestad',
 'longitude': '-70.0167',
 'latitude': '12.5167'}
This is just a list of data for the countries. We want to extract the iso2code for each country and also the name of the country.
# Use dictionary comprehension to extract iso2Codes and country names into a dictionary
country_iso2Code = {country["name"]: country["iso2Code"] for country in country_data}

country_iso2Code
{'Aruba': 'AW',
 'Africa Eastern and Southern': 'ZH',
 'Afghanistan': 'AF',
 'Africa': 'A9',
 'Africa Western and Central': 'ZI',
 'Angola': 'AO',
 'Albania': 'AL',
 'Andorra': 'AD',
 'Arab World': '1A',
 'United Arab Emirates': 'AE',
 'Argentina': 'AR',
 'Armenia': 'AM',
 'American Samoa': 'AS',
 'Antigua and Barbuda': 'AG',
 'Australia': 'AU',
 'Austria': 'AT',
 'Azerbaijan': 'AZ',
 'Burundi': 'BI',
 'East Asia & Pacific (IBRD-only countries)': 'B4',
 'Europe & Central Asia (IBRD-only countries)': 'B7',
 'Belgium': 'BE',
 'Benin': 'BJ',
 'Burkina Faso': 'BF',
 'Bangladesh': 'BD',
 'Bulgaria': 'BG',
 'IBRD countries classified as high income': 'B1',
 'Bahrain': 'BH',
 'Bahamas, The': 'BS',
 'Bosnia and Herzegovina': 'BA',
 'Latin America & the Caribbean (IBRD-only countries)': 'B2',
 'Belarus': 'BY',
 'Belize': 'BZ',
 'Middle East, North Africa, Afghanistan & Pakistan (IBRD only)': 'B3',
 'Bermuda': 'BM',
 'Bolivia': 'BO',
 'Brazil': 'BR',
 'Barbados': 'BB',
 'Brunei Darussalam': 'BN',
 'Sub-Saharan Africa (IBRD-only countries)': 'B6',
 'Bhutan': 'BT',
 'Botswana': 'BW',
 'Sub-Saharan Africa (IFC classification)': 'C9',
 'Central African Republic': 'CF',
 'Canada': 'CA',
 'East Asia and the Pacific (IFC classification)': 'C4',
 'Central Europe and the Baltics': 'B8',
 'Europe and Central Asia (IFC classification)': 'C5',
 'Switzerland': 'CH',
 'Channel Islands': 'JG',
 'Chile': 'CL',
 'China': 'CN',
 "Cote d'Ivoire": 'CI',
 'Latin America and the Caribbean (IFC classification)': 'C6',
 'Middle East and North Africa (IFC classification)': 'C7',
 'Cameroon': 'CM',
 'Congo, Dem. Rep.': 'CD',
 'Congo, Rep.': 'CG',
 'Colombia': 'CO',
 'Comoros': 'KM',
 'Cabo Verde': 'CV',
 'Costa Rica': 'CR',
 'South Asia (IFC classification)': 'C8',
 'Caribbean small states': 'S3',
 'Cuba': 'CU',
 'Curacao': 'CW',
 'Cayman Islands': 'KY',
 'Cyprus': 'CY',
 'Czechia': 'CZ',
 'East Asia & Pacific (IDA-eligible countries)': 'D4',
 'Europe & Central Asia (IDA-eligible countries)': 'D7',
 'Germany': 'DE',
 'Djibouti': 'DJ',
 'Latin America & the Caribbean (IDA-eligible countries)': 'D2',
 'Dominica': 'DM',
 'Middle East, North Africa, Afghanistan & Pakistan (IDA total)': 'D3',
 'Denmark': 'DK',
 'IDA countries in Sub-Saharan Africa not classified as fragile situations ': 'N6',
 'Dominican Republic': 'DO',
 'South Asia (IDA-eligible countries)': 'D5',
 'IDA countries in Sub-Saharan Africa classified as fragile situations ': 'F6',
 'Sub-Saharan Africa (IDA-eligible countries)': 'D6',
 'Algeria': 'DZ',
 'East Asia & Pacific (excluding high income)': '4E',
 'Early-demographic dividend': 'V2',
 'East Asia & Pacific': 'Z4',
 'Europe & Central Asia (excluding high income)': '7E',
 'Europe & Central Asia': 'Z7',
 'Ecuador': 'EC',
 'Egypt, Arab Rep.': 'EG',
 'Euro area': 'XC',
 'Eritrea': 'ER',
 'Spain': 'ES',
 'Estonia': 'EE',
 'Ethiopia': 'ET',
 'European Union': 'EU',
 'Fragile and conflict affected situations': 'F1',
 'Finland': 'FI',
 'Fiji': 'FJ',
 'France': 'FR',
 'Faroe Islands': 'FO',
 'Micronesia, Fed. Sts.': 'FM',
 'IDA countries classified as fragile situations, excluding Sub-Saharan Africa': '6F',
 'Gabon': 'GA',
 'United Kingdom': 'GB',
 'Georgia': 'GE',
 'Ghana': 'GH',
 'Gibraltar': 'GI',
 'Guinea': 'GN',
 'Gambia, The': 'GM',
 'Guinea-Bissau': 'GW',
 'Equatorial Guinea': 'GQ',
 'Greece': 'GR',
 'Grenada': 'GD',
 'Greenland': 'GL',
 'Guatemala': 'GT',
 'Guam': 'GU',
 'Guyana': 'GY',
 'High income': 'XD',
 'Hong Kong SAR, China': 'HK',
 'Honduras': 'HN',
 'Heavily indebted poor countries (HIPC)': 'XE',
 'Croatia': 'HR',
 'Haiti': 'HT',
 'Hungary': 'HU',
 'IBRD, including blend': 'ZB',
 'IBRD only': 'XF',
 'IDA & IBRD total': 'ZT',
 'IDA total': 'XG',
 'IDA blend': 'XH',
 'Indonesia': 'ID',
 'IDA only': 'XI',
 'Isle of Man': 'IM',
 'India': 'IN',
 'Not classified': 'XY',
 'Ireland': 'IE',
 'Iran, Islamic Rep.': 'IR',
 'Iraq': 'IQ',
 'Iceland': 'IS',
 'Israel': 'IL',
 'Italy': 'IT',
 'Jamaica': 'JM',
 'Jordan': 'JO',
 'Japan': 'JP',
 'Kazakhstan': 'KZ',
 'Kenya': 'KE',
 'Kyrgyz Republic': 'KG',
 'Cambodia': 'KH',
 'Kiribati': 'KI',
 'St. Kitts and Nevis': 'KN',
 'Korea, Rep.': 'KR',
 'Kuwait': 'KW',
 'Latin America & Caribbean (excluding high income)': 'XJ',
 'Lao PDR': 'LA',
 'Lebanon': 'LB',
 'Liberia': 'LR',
 'Libya': 'LY',
 'St. Lucia': 'LC',
 'Latin America & Caribbean ': 'ZJ',
 'Least developed countries: UN classification': 'XL',
 'Low income': 'XM',
 'Liechtenstein': 'LI',
 'Sri Lanka': 'LK',
 'Lower middle income': 'XN',
 'Low & middle income': 'XO',
 'Lesotho': 'LS',
 'Late-demographic dividend': 'V3',
 'Lithuania': 'LT',
 'Luxembourg': 'LU',
 'Latvia': 'LV',
 'Macao SAR, China': 'MO',
 'St. Martin (French part)': 'MF',
 'Morocco': 'MA',
 'Monaco': 'MC',
 'Moldova': 'MD',
 'Middle East (developing only)': 'M1',
 'Madagascar': 'MG',
 'Maldives': 'MV',
 'Middle East, North Africa, Afghanistan & Pakistan': 'ZQ',
 'Mexico': 'MX',
 'Marshall Islands': 'MH',
 'Middle income': 'XP',
 'North Macedonia': 'MK',
 'Mali': 'ML',
 'Malta': 'MT',
 'Myanmar': 'MM',
 'Middle East, North Africa, Afghanistan & Pakistan (excluding high income)': 'XQ',
 'Montenegro': 'ME',
 'Mongolia': 'MN',
 'Northern Mariana Islands': 'MP',
 'Mozambique': 'MZ',
 'Mauritania': 'MR',
 'Mauritius': 'MU',
 'Malawi': 'MW',
 'Malaysia': 'MY',
 'North America': 'XU',
 'North Africa': 'M2',
 'Namibia': 'NA',
 'New Caledonia': 'NC',
 'Niger': 'NE',
 'Nigeria': 'NG',
 'Nicaragua': 'NI',
 'Netherlands': 'NL',
 'Norway': 'NO',
 'Nepal': 'NP',
 'Non-resource rich Sub-Saharan Africa countries': '6X',
 'Nauru': 'NR',
 'IDA countries not classified as fragile situations, excluding Sub-Saharan Africa': '6N',
 'New Zealand': 'NZ',
 'OECD members': 'OE',
 'Oman': 'OM',
 'Other small states': 'S4',
 'Pakistan': 'PK',
 'Panama': 'PA',
 'Peru': 'PE',
 'Philippines': 'PH',
 'Palau': 'PW',
 'Papua New Guinea': 'PG',
 'Poland': 'PL',
 'Pre-demographic dividend': 'V1',
 'Puerto Rico (US)': 'PR',
 "Korea, Dem. People's Rep.": 'KP',
 'Portugal': 'PT',
 'Paraguay': 'PY',
 'West Bank and Gaza': 'PS',
 'Pacific island small states': 'S2',
 'Post-demographic dividend': 'V4',
 'French Polynesia': 'PF',
 'Qatar': 'QA',
 'Romania': 'RO',
 'Resource rich Sub-Saharan Africa countries': 'R6',
 'Russian Federation': 'RU',
 'Rwanda': 'RW',
 'South Asia': '8S',
 'Saudi Arabia': 'SA',
 'Sudan': 'SD',
 'Senegal': 'SN',
 'Singapore': 'SG',
 'Solomon Islands': 'SB',
 'Sierra Leone': 'SL',
 'El Salvador': 'SV',
 'San Marino': 'SM',
 'Somalia': 'SO',
 'Serbia': 'RS',
 'Sub-Saharan Africa (excluding high income)': 'ZF',
 'South Sudan': 'SS',
 'Sub-Saharan Africa ': 'ZG',
 'Small states': 'S1',
 'Sao Tome and Principe': 'ST',
 'Suriname': 'SR',
 'Slovak Republic': 'SK',
 'Slovenia': 'SI',
 'Sweden': 'SE',
 'Eswatini': 'SZ',
 'Sint Maarten (Dutch part)': 'SX',
 'Sub-Saharan Africa excluding South Africa': 'A4',
 'Seychelles': 'SC',
 'Syrian Arab Republic': 'SY',
 'Turks and Caicos Islands': 'TC',
 'Chad': 'TD',
 'East Asia & Pacific (IDA & IBRD countries)': 'T4',
 'Europe & Central Asia (IDA & IBRD countries)': 'T7',
 'Togo': 'TG',
 'Thailand': 'TH',
 'Tajikistan': 'TJ',
 'Turkmenistan': 'TM',
 'Latin America & the Caribbean (IDA & IBRD countries)': 'T2',
 'Timor-Leste': 'TL',
 'Middle East, North Africa, Afghanistan & Pakistan (IDA & IBRD)': 'T3',
 'Tonga': 'TO',
 'South Asia (IDA & IBRD)': 'T5',
 'Sub-Saharan Africa (IDA & IBRD countries)': 'T6',
 'Trinidad and Tobago': 'TT',
 'Tunisia': 'TN',
 'Turkiye': 'TR',
 'Tuvalu': 'TV',
 'Tanzania': 'TZ',
 'Uganda': 'UG',
 'Ukraine': 'UA',
 'Upper middle income': 'XT',
 'Uruguay': 'UY',
 'United States': 'US',
 'Uzbekistan': 'UZ',
 'St. Vincent and the Grenadines': 'VC',
 'Venezuela, RB': 'VE',
 'British Virgin Islands': 'VG',
 'Virgin Islands (U.S.)': 'VI',
 'Viet Nam': 'VN',
 'Vanuatu': 'VU',
 'World': '1W',
 'Samoa': 'WS',
 'Kosovo': 'XK',
 'Sub-Saharan Africa excluding South Africa and Nigeria': 'A5',
 'Yemen, Rep.': 'YE',
 'South Africa': 'ZA',
 'Zambia': 'ZM',
 'Zimbabwe': 'ZW'}
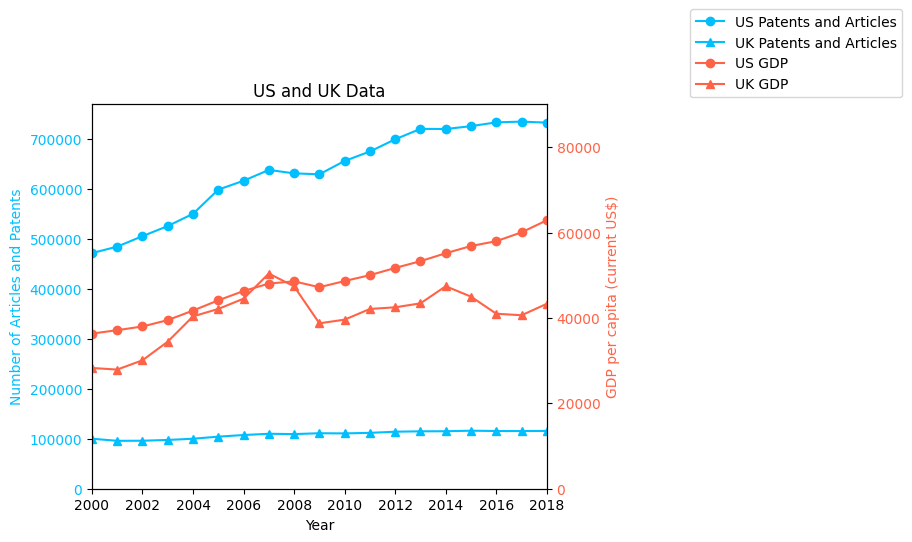
2. Comparing Economic Indicators between Two Countries#
In this section, we will fetch data for multiple countries across multiple years and visualize the results. We’ll demonstrate how to:
Send multiple API requests (or page through a single request if needed).
Parse the returned data into a structured format.
Visualize the GDP data using
matplotlib.
See the World Bank site for a list of indicators.
We will select three indicators for this example:
Scientific and Technical Journal Article Data = IP.JRN.ARTC.SC
Patent Applications, residents = IP.PAT.RESD
GDP per capita (current US$) Code = NY.GDP.PCAP.CD
Note that these three selected indicators have a CC-BY 4.0 license. We will compile this indicator data for the United States (US) and United Kingdom (GB).
indicators = ['IP.JRN.ARTC.SC','IP.PAT.RESD','NY.GDP.PCAP.CD']

# Extract iso2Codes from previous results
US_ISO2CODE = country_iso2Code['United States']
UK_ISO2CODE = country_iso2Code['United Kingdom']

# Display results of lookup
US_ISO2CODE, UK_ISO2CODE
('US', 'GB')
Now we want to compile the data for the three indicators for the United States (US) and United Kingdom (GB).
US_indicator_data = {}
UK_indicator_data = {}
http_params = {
    "format": "json",
    "per_page": 500,
}

for indicator in indicators:
    try:
        response = requests.get(
            f"{BASE_URL}/{US_ISO2CODE}/indicator/{indicator}",
            params=http_params
        )
        sleep(1)
        response.raise_for_status()
        US_indicator_data[indicator] = response.json()
        print(f"Successfully retrieved data for {indicator} for {US_ISO2CODE}")
    except requests.exceptions.RequestException as e:
        print(f"Error for {indicator} for {US_ISO2CODE}: {e}")
        US_indicator_data[indicator] = []

    try:
        response = requests.get(
            f"{BASE_URL}/{UK_ISO2CODE}/indicator/{indicator}",
            params=http_params
        )
        sleep(1)
        response.raise_for_status()
        UK_indicator_data[indicator] = response.json()
        print(f"Successfully retrieved data for {indicator} for {UK_ISO2CODE}")
    except requests.exceptions.RequestException as e:
        print(f"Error for {indicator} for {UK_ISO2CODE}: {e}")
        UK_indicator_data[indicator] = []
Successfully retrieved data for IP.JRN.ARTC.SC for US
Successfully retrieved data for IP.JRN.ARTC.SC for GB
Successfully retrieved data for IP.PAT.RESD for US
Successfully retrieved data for IP.PAT.RESD for GB
Successfully retrieved data for NY.GDP.PCAP.CD for US
Successfully retrieved data for NY.GDP.PCAP.CD for GB
# Print first 3 entries in 'Scientific and Technical Journal Article Data'
US_indicator_data['IP.JRN.ARTC.SC'][1][:3]
[{'indicator': {'id': 'IP.JRN.ARTC.SC',
   'value': 'Scientific and technical journal articles'},
  'country': {'id': 'US', 'value': 'United States'},
  'countryiso3code': 'USA',
  'date': '2024',
  'value': None,
  'unit': '',
  'obs_status': '',
  'decimal': 0},
 {'indicator': {'id': 'IP.JRN.ARTC.SC',
   'value': 'Scientific and technical journal articles'},
  'country': {'id': 'US', 'value': 'United States'},
  'countryiso3code': 'USA',
  'date': '2023',
  'value': None,
  'unit': '',
  'obs_status': '',
  'decimal': 0},
 {'indicator': {'id': 'IP.JRN.ARTC.SC',
   'value': 'Scientific and technical journal articles'},
  'country': {'id': 'US', 'value': 'United States'},
  'countryiso3code': 'USA',
  'date': '2022',
  'value': 457335.25,
  'unit': '',
  'obs_status': '',
  'decimal': 0}]
Now we need to extract the data and compile for analysis for both the United States and United Kingdom.
Key: Year
Column 1: Scientific and Technical Journal Article Data =
IP.JRN.ARTC.SCColumn 2: Patent Applications, residents =
IP.PAT.RESDColumn 3: GDP per capita (current US$) Code =
NY.GDP.PCAP.CD
US_data = {}
UK_data = {}

for indicator in indicators:
    if US_indicator_data[indicator]:
        for record in US_indicator_data[indicator][1]:
            year = int(record["date"])
            value = float(record["value"] or 'nan')
            if year not in US_data:
                US_data[year] = []
            US_data[year].append(value)
    if UK_indicator_data[indicator]:
        for record in UK_indicator_data[indicator][1]:
            year = int(record["date"])
            value = float(record["value"] or 'nan')
            if year not in UK_data:
                UK_data[year] = []
            UK_data[year].append(value)
# Print the raw structure of the US data
US_data
{2024: [nan, nan, 85809.9003846356],
 2023: [nan, nan, 82304.6204272866],
 2022: [457335.25, nan, 77860.9112908848],
 2021: [472448.44, 262244.0, 71307.4017277218],
 2020: [457586.9, 269586.0, 64401.5074354212],
 2019: [451480.17, 285113.0, 65227.9565911038],
 2018: [447164.41, 285095.0, 62875.6661382728],
 2017: [440417.99, 293904.0, 60047.7190728307],
 2016: [437546.04, 295327.0, 57976.628204291],
 2015: [436908.38, 288335.0, 56849.4697923159],
 2014: [434412.33, 285096.0, 55153.3940182967],
 2013: [432033.06, 287831.0, 53297.3862901595],
 2012: [430163.93, 268782.0, 51708.3940614082],
 2011: [426831.73, 247750.0, 50024.8812320773],
 2010: [413704.71, 241977.0, 48642.6312088213],
 2009: [404007.54, 224912.0, 47194.9500893872],
 2008: [399273.41, 231588.0, 48570.0594269601],
 2007: [396306.1, 241347.0, 48050.227412195],
 2006: [394240.08, 221784.0, 46301.9876485519],
 2005: [390402.56, 207867.0, 44123.3996470026],
 2004: [360328.73, 189536.0, 41724.6411982614],
 2003: [336490.55, 188941.0, 39490.3023903176],
 2002: [320944.51, 184245.0, 37997.7424300242],
 2001: [306733.89, 177513.0, 37133.6203973517],
 2000: [306472.5, 164795.0, 36329.9702595751],
 1999: [296940.93, 149251.0, 34515.3813073394],
 1998: [302600.31, 134733.0, 32853.6725949234],
 1997: [311116.82, 119214.0, 31459.1299691554],
 1996: [313391.54, 106892.0, 29967.7127181749],
 1995: [nan, 123962.0, 28690.8757013347],
 1994: [nan, 107233.0, 27694.853416234],
 1993: [nan, 99955.0, 26387.2937338171],
 1992: [nan, 92425.0, 25418.9907763319],
 1991: [nan, 87955.0, 24342.2589048189],
 1990: [nan, 90643.0, 23888.6000088133],
 1989: [nan, 82370.0, 22857.1544330056],
 1988: [nan, 75192.0, 21417.0119305191],
 1987: [nan, 68315.0, 20038.9410992658],
 1986: [nan, 65195.0, 19071.2271949295],
 1985: [nan, 63673.0, 18236.8277265009],
 1984: [nan, 61841.0, 17121.2254849995],
 1983: [nan, 59391.0, 15543.8937174925],
 1982: [nan, 63316.0, 14433.787727053],
 1981: [nan, 62404.0, 13976.10539252],
 1980: [nan, 62098.0, 12574.7915062163],
 1979: [nan, nan, 11674.1818666548],
 1978: [nan, nan, 10564.9482220275],
 1977: [nan, nan, 9452.57651914511],
 1976: [nan, nan, 8592.25353727612],
 1975: [nan, nan, 7801.45666356443],
 1974: [nan, nan, 7225.69135952566],
 1973: [nan, nan, 6726.35895596695],
 1972: [nan, nan, 6094.01798986165],
 1971: [nan, nan, 5609.38259952519],
 1970: [nan, nan, 5234.2966662115],
 1969: [nan, nan, 5025.09477492148],
 1968: [nan, nan, 4691.63403587259],
 1967: [nan, nan, 4331.58115274285],
 1966: [nan, nan, 4141.64653851663],
 1965: [nan, nan, 3826.51724799466],
 1964: [nan, nan, 3573.06354552111],
 1963: [nan, nan, 3373.3573050342],
 1962: [nan, nan, 3241.857658528],
 1961: [nan, nan, 3062.97411600143],
 1960: [nan, nan, 3002.08929545597]}
Visualize the Data#
Let’s create a simple bar chart comparing GDP for each country in a specific year. You can extend this to line charts if you want to visualize trends over multiple years.
data_years = list(US_data.keys())
data_years.sort()

US_patentsandarticles = []
US_gdp = []
UK_patentsandarticles = []
UK_gdp = []
for years in data_years:
    US_patentsandarticles.append(US_data.get(years)[0]+US_data.get(years)[1])
    US_gdp.append(US_data.get(years)[2])

    UK_patentsandarticles.append(UK_data.get(years)[0]+UK_data.get(years)[1])
    UK_gdp.append(UK_data.get(years)[2])
fig, ax1 = plt.subplots()

# Left y-axis
ax1.set_xlabel("Year")
ax1.set_ylabel("Number of Articles and Patents", color="deepskyblue")
ax1.plot(data_years, US_patentsandarticles, label="US Patents and Articles",
         marker="o", color="deepskyblue")
ax1.plot(data_years, UK_patentsandarticles, label="UK Patents and Articles",
         marker="^", color="deepskyblue")
ax1.tick_params(axis='y', labelcolor="deepskyblue")
ax1.set_ylim(bottom=0)

# Right y-axis
ax2 = ax1.twinx()
ax2.set_ylabel("GDP per capita (current US$)", color="tomato")
ax2.plot(data_years, US_gdp, label="US GDP", marker="o", color="tomato")
ax2.plot(data_years, UK_gdp, label="UK GDP", marker="^", color="tomato")
ax2.tick_params(axis='y', labelcolor="tomato")
ax2.set_ylim(bottom=0)

# Main title, layout, and x-limits
plt.title("US and UK Data")
plt.xlim(2000, 2018)
fig.tight_layout()

# Combine legends from both axes
lines_labels = [ax.get_legend_handles_labels() for ax in (ax1, ax2)]
lines, labels = [sum(lol, []) for lol in zip(*lines_labels)]
plt.legend(lines, labels, bbox_to_anchor=(1.3, 1), ncol=1)

# Finally, show the plot
plt.show()