SEC EDGAR API in Python#
by Michael T. Moen
The U.S. Securities and Exchange Commission (SEC) allows free public access to documents filed by publicly traded companies in the Electronic Data Gathering, Analysis, and Retrieval (EDGAR) system.
Please see the following resources for more information on API usage:
Documentation
Terms
Data Reuse
NOTE: The SEC EDGAR API limits requests to a maximum of 10 requests per second.
These recipe examples were tested on May 6, 2025.
Setup#
Import Libraries#
The following external libraries need to be installed into your environment to run the code examples in this tutorial:
We import the libraries used in this tutorial below:
import requests
import matplotlib.pyplot as plt
from math import log10
from dotenv import load_dotenv
import os
Import User Agent#
An user agent is required to access the SEC EDGAR API.
We keep our user agent in a .env file and use the dotenv library to access it. If you would like to use this method, create a .env file and add the following line to it:
SEC_EDGAR_USER_AGENT="Institution Name email@domain.com"
load_dotenv()
try:
    headers = {'User-Agent': os.environ["SEC_EDGAR_USER_AGENT"]}
except KeyError:
    print("API key not found. Please set 'SEC_EDGAR_USER_AGENT' in your .env file.")
SEC EDGAR Data Installation#
In addition to the publicly available API, SEC EDGAR data can also be access via a bulk data download, which is compiled nightly. This approach is advantageous when working with large datasets, since it does not require making many individual API calls. However, it requires about 15 GB of storage to install and is more difficult to keep up to date.
To access this data, download the companyfacts.zip file under the ‘Bulk data’ heading at the bottom of the SEC EDGAR documentation.
1. Obtaining Marketing Expenses for Amazon#
To access the data from an individual company, we must first obtain its Central Index Key (CIK) value. These values can be obtained by searching for a company here. Alternatively, you can find a list of all companies and their CIK value here.
For this section of the guide, we’ll use Amazon (AMZN) as an example, which has a CIK of 0001018724.
With this CIK, we can now build a URL for the /companyfacts/ endpoint:
cik = '0001018724'
url = f'https://data.sec.gov/api/xbrl/companyfacts/CIK{cik}.json'

data = requests.get(url, headers=headers).json()
Now, we can look at all of the data included in that API request:
# Output too large to display, uncomment the following line to view
# data
We can also access individual pieces of information with our retrieved data:
NOTE: It may be useful to open the URL we created in Firefox, which has a built in JSON viewer that other browsers lack.
company_name = data['entityName']
company_name
'AMAZON.COM, INC.'
For an example, let’s look at the yearly marketing expenses of Amazon, which is defined as “Expenditures for planning and executing the conception, pricing, promotion, and distribution of ideas, goods, and services. Costs of public relations and corporate promotions are typically considered to be marketing costs.”
# Navigate the JSON data structure to get us to the marketing expenses data
marketing_expenses = data['facts']['us-gaap']['MarketingExpense']['units']['USD']

total_marketing_expenses = 0    # Sum of marketing expenses in period
yearly_marketing_expenses = []  # List of tuples with (year, value) pairings

# Iterate through list of marketing expense data in filings
for expense in marketing_expenses:

    # Check if the filing period in the entry is a filing year,
    # so we don't double-count by also adding data from quarterly filings
    if expense['fp'] == 'FY':

        # Check if the filing year is already in yearly_marketing_expenses
        if not any(expense['start'][:4] in i for i in yearly_marketing_expenses):

            total_marketing_expenses += expense['val']
            yearly_marketing_expenses.append((expense['start'][:4], expense['val']))

# Display results
for expense in yearly_marketing_expenses:
    print(f'{expense[0]}: ${expense[1]}')
start_year, end_year = yearly_marketing_expenses[0][0], yearly_marketing_expenses[-1][0]
print(f'{start_year}-{end_year} total: ${total_marketing_expenses}')
2007: $344000000
2008: $482000000
2009: $680000000
2010: $1029000000
2011: $1630000000
2012: $2408000000
2013: $3133000000
2014: $4332000000
2015: $5254000000
2016: $7233000000
2017: $10069000000
2018: $13814000000
2019: $18878000000
2020: $22008000000
2021: $32551000000
2022: $42238000000
2023: $44370000000
2024: $43907000000
2007-2024 total: $254360000000
The following code block scales the data so that the y-axis of our graph contains smaller numbers that can be more easily understood, rather than large values in the billions.
# Break up the list of tuples forming 'yearly_expenses' into two separate lists
years, expenses = zip(*yearly_marketing_expenses)

# Create scale for bar graph
min = sorted(list(expenses), key=float)[0]
exponent = len(str(int(min)))

# Change the data to fit the scale
expenses = [x/(10**exponent) for x in expenses]
Finally, we can plot the data:
# Create graphing window with size 13x8
fig, ax = plt.subplots(figsize=(13,8))

# Format the bar graph
ax.spines['top'].set_visible(False)
ax.spines['right'].set_visible(False)
ax.spines['left'].set_visible(False)
ax.spines['bottom'].set_color('#CCCCCC')
ax.tick_params(bottom=False, left=False)
ax.set_axisbelow(True)
ax.yaxis.grid(True, color='#EEEEEE')
ax.xaxis.grid(False)

# Plot the graph and add titles
plt.bar(years, expenses, color='#4d4d4d')
plt.title(company_name + " Marketing Expenses")
plt.xlabel("Fiscal Year")
plt.ylabel(f"Marketing Expenses (* 10^-{exponent})")

plt.show()
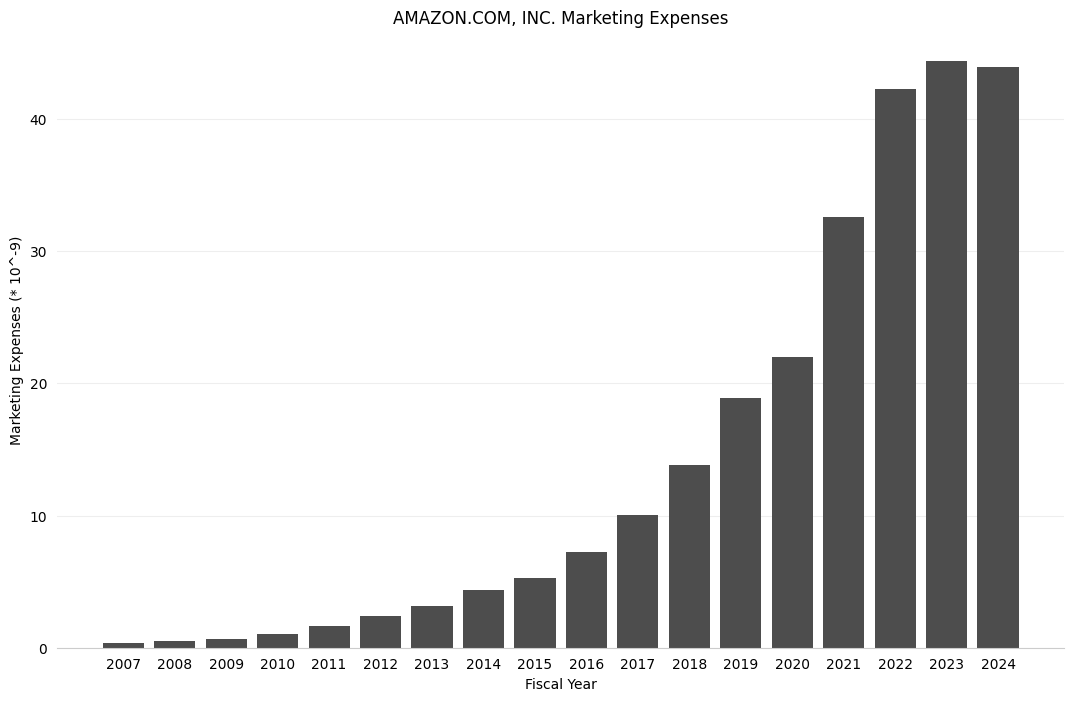
Note that the scaling of the data allowed us to present the data in terms of billions of dollars.
3. Comparing Total Assets of All Filing Companies#
The SEC EDGAR API also has an endpoint called /frames/ that returns the data from all companies for a given category and filing period. In this example, we’ll look at the total assets of all companies reported for Q1 2024.
# Categories can be found in the JSON data obtained from the /companyfacts/ endpoint
# Note that you also must include the units name for some categories (in this case, USD)
category = 'Assets/USD'
year = '2024'
quarter = '1'
url = f'https://data.sec.gov/api/xbrl/frames/us-gaap/{category}/CY{year}Q{quarter}I.json'

data_retrieved = requests.get(url, headers=headers).json()

# display number of results
len(data_retrieved['data'])
5788
Now, let’s retrieve the company names and asset values of all of the companies. Below, we store this data as a list of tuples in the total_assets list and sort it:
# Build list of tuples with (companyName, value) pairings
total_assets = [(entry['entityName'], int(entry['val'])) for entry in data_retrieved['data']]

# Sort list of tuples by value of second part of tuple
total_assets = sorted(total_assets, key = lambda x: x[1])

# Reverse list to put the highest values on top
total_assets.reverse()

# display top 20 results
total_assets[:20]
[('FEDERAL NATIONAL MORTGAGE ASSOCIATION FANNIE MAE', 4323819000000),
 ('JPMorgan Chase & Co', 4090727000000),
 ('Federal Home Loan Mortgage Corporation', 3287373000000),
 ('Bank of America Corporation', 3273803000000),
 ('Citigroup\xa0Inc', 2432510000000),
 ('WELLS FARGO & COMPANY/MN', 1959153000000),
 ('The Goldman Sachs Group, Inc.', 1698440000000),
 ('MORGAN STANLEY', 1228503000000),
 ('BERKSHIRE HATHAWAY INC', 1070035000000),
 ('Prudential Financial, Inc.', 725823000000),
 ('US BANCORP \\DE\\', 683606000000),
 ('MetLife, Inc.', 677576000000),
 ('PNC Financial Services Group, Inc.', 566162000000),
 ('American International Group, Inc.', 544121000000),
 ('TRUIST FINANCIAL CORPORATION', 534959000000),
 ('AMAZON.COM, INC.', 530969000000),
 ('HDFC BANK LIMITED', 529380600000),
 ('MICROSOFT CORPORATION', 484275000000),
 ('CAPITAL\xa0ONE\xa0FINANCIAL\xa0CORP', 481720000000),
 ('SCHWAB CHARLES CORP', 468784000000)]
Graphing the Total Assets of All Companies#
Since the total assets of all companies is a dataset that ranges from values as low as zero to those as large as 4.3 trillion, these values must be graphed logarithmically. Below, we take the log10 of each of the total asset values so that we can group the total assets in groups of ones (100), tens (101), hundreds (102), thousands (103), and so on. Then, we’ll use matplotlib to graph these values with a histogram.
Note: Since 0 is outside the domain of the log function, it must be handled separately in order to avoid throwing an error. In this case, we group these values into the ones (100) group, although this is not actually true.
weighted_vals = []  # List of log10(total_assets) for each company

for company in total_assets:
    if company[1] == 0:
        weighted_vals.append(0)
    else:
        weighted_vals.append(log10(company[1]))

n_bins = int(max(weighted_vals))+1  # Number of bins to put data into for the histogram
bins = range(n_bins+1)              # Bin titles
# Create graphing window with size 13x8
fig, ax = plt.subplots(figsize=(13,8))

# Format the bar graph
ax.spines['top'].set_visible(False)
ax.spines['right'].set_visible(False)
ax.spines['left'].set_visible(False)
ax.spines['bottom'].set_color('#CCCCCC')
ax.tick_params(bottom=False, left=False)
ax.set_axisbelow(True)
ax.yaxis.grid(True, color='#DDDDDD')
ax.xaxis.grid(False)
ax.set_xticks(bins)

# Plot the graph and add titles
plt.hist(weighted_vals, color='#4d4d4d', bins=bins)
plt.title(f"Companies by Total Assets Reported for Q{quarter} {year} (Logarithmic)")
plt.xlabel("Assets (in 10^n USD)")
plt.ylabel(f"Number of Companies")

plt.show()

Note that for the above data, the 0-1 bucket indicates that a company reported between 0 and 9 USD in assets, while the 12-13 bucket indicates that a company reported between 1012 and 1013 (or one trillion and ten trillion) USD in assets.
4. Finding the Top 500 Companies by Revenue#
The Fortune 500 is a ranking of the top 500 companies by revenue, according to the data filed in their 10-K or a comparable form. In this example, we’ll look at only the revenues reported in the 10-K forms to construct a similar ranking of U.S. companies by revenue.
category = 'Revenues/USD'
year = '2024'
url = f'https://data.sec.gov/api/xbrl/frames/us-gaap/{category}/CY{year}.json'

data = requests.get(url, headers=headers).json()

# Display number of results
len(data_retrieved['data'])
5788
Now, we can sort this data by value and keep the top 500 results:
# List of tuples with ('company name', revenue) pairings
total_revenues = [(entry['entityName'], entry['val']) for entry in data['data']]

# Sort total_revenues by revenues
total_revenues = sorted(total_revenues, key = lambda x: x[1])

# Reverse to put the greatest values on top
total_revenues.reverse()

# Keep top 500 results
total_revenues = total_revenues[:500]

# Display results
total_revenues
for idx, company in enumerate(total_revenues):
    print(f'{idx+1:>3}. ${company[1]:>12}: {company[0]}')
  1. $680985000000: WALMART INC.
  2. $400278000000: UnitedHealth Group Incorporated
  3. $372809000000: CVS HEALTH CORPORATION
  4. $371433000000: BERKSHIRE HATHAWAY INC
  5. $349585000000: Exxon Mobil Corporation
  6. $293958599000: CENCORA, INC.
  7. $254453000000: COSTCO WHOLESALE CORP /NEW
  8. $247121000000: The Cigna Group
  9. $226827000000: Cardinal Health, Inc.
 10. $202792000000: Chevron Corp
 11. $187442000000: GENERAL MOTORS COMPANY
 12. $184992000000: Ford Motor Co
 13. $177556000000: JPMorgan Chase & Co
 14. $177011000000: ELEVANCE HEALTH, INC.
 15. $163071000000: Centene Corporation
 16. $134788000000: Verizon Communications Inc.
 17. $130497000000: NVIDIA CORP
 18. $122336000000: AT&T INC.
 19. $117761000000: HUMANA INC.
 20. $101887000000: Bank of America Corporation
 21. $ 99887800000: StoneX Group Inc.
 22. $ 97690000000: Tesla, Inc.
 23. $ 95567000000: Dell Technologies Inc.
 24. $ 91854000000: PepsiCo, Inc.
 25. $ 91361000000: WALT DISNEY CO/
 26. $ 85530000000: ARCHER-DANIELS-MIDLAND CO
 27. $ 84039000000: PROCTER & GAMBLE CO
 28. $ 82671000000: ENERGY TRANSFER LP
 29. $ 81139000000: Citigroup Inc
 30. $ 80738000000: RTX CORPORATION
 31. $ 75372000000: PROGRESSIVE CORP/OH/
 32. $ 71043000000: LOCKHEED MARTIN CORPORATION
 33. $ 70986000000: MetLife, Inc.
 34. $ 70603000000: HCA Healthcare, Inc.
 35. $ 70405000000: PRUDENTIAL FINANCIAL INC
 36. $ 66517000000: BOEING CO
 37. $ 64896464000: Accenture plc
 38. $ 64809000000: CATERPILLAR INC
 39. $ 64168000000: Merck & Co., Inc.
 40. $ 64106000000: ALLSTATE CORP
 41. $ 63627000000: PFIZER INC
 42. $ 62753000000: INTERNATIONAL BUSINESS MACHINES CORPORATION
 43. $ 60177000000: PUBLIX SUPER MARKETS, INC.
 44. $ 56334000000: AbbVie Inc.
 45. $ 56219000000: ENTERPRISE PRODUCTS PARTNERS L.P.
 46. $ 55753000000: CHUBB LIMITED
 47. $ 55085000000: CCO Holdings, LLC
 48. $ 55085000000: Charter Communications, Inc.
 49. $ 54745000000: ConocoPhillips
 50. $ 53559000000: HP Inc.
 51. $ 53309000000: TYSON FOODS, INC.
 52. $ 53108000000: BUNGE GLOBAL SA
 53. $ 51716000000: DEERE & CO
 54. $ 50073000000: PLAINS GP HOLDINGS LP
 55. $ 50073000000: PLAINS ALL AMERICAN PIPELINE LP
 56. $ 48300000000: BRISTOL-MYERS SQUIBB COMPANY
 57. $ 47716000000: GENERAL DYNAMICS CORPORATION
 58. $ 47061000000: COCA COLA CO
 59. $ 46423000000: Travelers Companies, Inc.
 60. $ 45042700000: ELI LILLY AND COMPANY
 61. $ 43978000000: UBER TECHNOLOGIES, INC.
 62. $ 42964000000: Dow Inc.
 63. $ 42168000000: WORLD KINECT CORPORATION
 64. $ 41915000000: Metropolitan Life Insurance Co
 65. $ 41528000000: BEST BUY CO., INC.
 66. $ 41033000000: NORTHROP GRUMMAN CORP /DE/
 67. $ 40650000000: MOLINA HEALTHCARE, INC.
 68. $ 40302000000: LyondellBasell Industries N.V.
 69. $ 39261229000: CHS Inc.
 70. $ 39112000000: CAPITAL ONE FINANCIAL CORP
 71. $ 39000966000: Netflix, Inc.
 72. $ 38962000000: QUALCOMM INC/DE
 73. $ 38702000000: GENERAL ELECTRIC COMPANY
 74. $ 36801400000: D.R. Horton, Inc.
 75. $ 36441000000: Mondelez International, Inc.
 76. $ 36176200000: Starbucks Corporation
 77. $ 35767000000: CBRE GROUP, INC.
 78. $ 35441452000: LENNAR CORP /NEW/
 79. $ 34102000000: CUMMINS INC.
 80. $ 33663800000: PACCAR Inc
 81. $ 31797000000: PayPal Holdings, Inc.
 82. $ 30127000000: HEWLETT PACKARD ENTERPRISE COMPANY
 83. $ 29635000000: Ferguson Enterprises Inc.
 84. $ 28167000000: Mastercard Incorporated
 85. $ 28130000000: NRG Energy, Inc
 86. $ 27923324000: ARROW ELECTRONICS, INC.
 87. $ 27455000000: US BANCORP \DE\
 88. $ 27251000000: American International Group, Inc.
 89. $ 26765400000: AUTONATION, INC.
 90. $ 26725000000: Occidental Petroleum Corporation
 91. $ 26724000000: The Southern Company
 92. $ 26535000000: The Hartford Insurance Group, Inc.
 93. $ 26353420000: CARMAX, INC.
 94. $ 26114000000: APOLLO GLOBAL MANAGEMENT, INC.
 95. $ 25920000000: BERKSHIRE HATHAWAY ENERGY COMPANY
 96. $ 25920000000: McDONALD’S CORPORATION
 97. $ 25455000000: Freeport-McMoRan Inc.
 98. $ 25100000000: MARRIOTT INTERNATIONAL INC /MD/
 99. $ 24575000000: 3M COMPANY
100. $ 24419000000: PG&E CORP
101. $ 24121053000: BLOCK, INC.
102. $ 23739000000: Booking Holdings Inc.
103. $ 23698000000: EOG RESOURCES, INC.
104. $ 23672795000: Quanta Services, Inc.
105. $ 23568000000: CONSTELLATION ENERGY CORPORATION
106. $ 23432900000: Jones Lang LaSalle Incorporated
107. $ 23155625000: LIVE NATION ENTERTAINMENT, INC.
108. $ 23028000000: EXELON CORPORATION
109. $ 23006000000: Macy's, Inc.
110. $ 22693000000: SUNOCO LP
111. $ 22595000000: STRYKER CORP
112. $ 22107000000: REINSURANCE GROUP OF AMERICA, INCORPORATED
113. $ 21878698000: KKR & CO. INC.
114. $ 21555000000: PNC FINANCIAL SERVICES GROUP, INC
115. $ 21505000000: ADOBE INC.
116. $ 20777000000: MercadoLibre, Inc.
117. $ 20689000000: ATHENE HOLDING LTD
118. $ 20456000000: Fiserv, Inc.
119. $ 20178000000: BECTON, DICKINSON AND COMPANY
120. $ 20058000000: KIMBERLY-CLARK CORPORATION
121. $ 19836000000: CNH INDUSTRIAL N.V.
122. $ 19736000000: COGNIZANT TECHNOLOGY SOLUTIONS CORPORATION
123. $ 19721300000: AMERICAN ELECTRIC POWER CO INC.
124. $ 19713000000: APTIV PLC
125. $ 19606000000: SCHWAB CHARLES CORP
126. $ 19202600000: AUTOMATIC DATA PROCESSING, INC.
127. $ 19185000000: CLEVELAND-CLIFFS INC.
128. $ 18927000000: Aflac Incorporated
129. $ 18781000000: Corebridge Financial, Inc.
130. $ 18619000000: THE BANK OF NEW YORK MELLON CORPORATION
131. $ 18490268000: AUTOZONE, INC
132. $ 18442000000: LINCOLN NATIONAL CORPORATION
133. $ 18418000000: REPUBLIC SERVICES, INC.
134. $ 17926000000: AMERIPRISE FINANCIAL, INC.
135. $ 17599000000: EDISON INTERNATIONAL
136. $ 17578500000: DOLLAR TREE, INC.
137. $ 17510000000: LOEWS CORP
138. $ 17440000000: ARCH CAPITAL GROUP LTD.
139. $ 17281000000: EVEREST GROUP, LTD.
140. $ 17224000000: Vistra Corp.
141. $ 17188600000: ASBURY AUTOMOTIVE GROUP, INC
142. $ 17163566000: Global Partners LP
143. $ 16908000000: Corteva, Inc.
144. $ 16662000000: Leidos Holdings, Inc.
145. $ 16620763000: MARKEL GROUP INC.
146. $ 16381500000: TARGA RESOURCES CORP.
147. $ 16315000000: FLUOR CORPORATION
148. $ 16285000000: INTUIT INC.
149. $ 16257000000: JONES FINANCIAL COMPANIES LLLP
150. $ 16127700000: PRINCIPAL FINANCIAL GROUP, INC
151. $ 15940000000: DEVON ENERGY CORP/DE
152. $ 15875000000: General Motors Financial Company, Inc.
153. $ 15703000000: CHENIERE ENERGY, INC.
154. $ 15689100000: OMNICOM GROUP INC.
155. $ 15640000000: United States Steel Corp
156. $ 15365700000: STANLEY BLACK & DECKER, INC.
157. $ 15345000000: United Rentals, Inc.
158. $ 15256000000: Consolidated Edison, Inc.
159. $ 15100000000: Kinder Morgan, Inc.
160. $ 15086000000: GAP, INC
161. $ 15016000000: Nordstrom, Inc.
162. $ 14923000000: RAYMOND JAMES FINANCIAL, INC.
163. $ 14883231000: TRACTOR SUPPLY CO /DE/
164. $ 14739300000: VIATRIS INC.
165. $ 14566116000: EMCOR Group, Inc.
166. $ 14459000000: DOMINION ENERGY, INC.
167. $ 14355000000: LKQ CORPORATION
168. $ 14270000000: CNA FINANCIAL CORPORATION
169. $ 14103000000: BROOKFIELD WEALTH SOLUTIONS LTD.
170. $ 14086000000: BorgWarner Inc.
171. $ 13702000000: Textron Inc.
172. $ 13681000000: FIDELITY NATIONAL FINANCIAL, INC.
173. $ 13638752000: W. R. BERKLEY CORP
174. $ 13472000000: FIRSTENERGY CORP
175. $ 13253000000: Ford Motor Credit Company LLC
176. $ 13229968000: Blackstone Inc.
177. $ 13185000000: SEMPRA
178. $ 13118000000: CORNING INC /NY
179. $ 13108000000: Lumen Technologies, Inc.
180. $ 13008900000: LABCORP HOLDINGS INC.
181. $ 13000000000: STATE STREET CORPORATION
182. $ 12896000000: Hess Corporation
183. $ 12887300000: Unum Group
184. $ 12815550000: DAVITA INC.
185. $ 12794000000: BlackRock, Inc.
186. $ 12749000000: Kellanova
187. $ 12636000000: RYDER SYSTEM, INC.
188. $ 12634000000: COMMUNITY HEALTH SYSTEMS, INC.
189. $ 12425000000: Equitable Holdings, Inc.
190. $ 12385107000: LPL Financial Holdings Inc.
191. $ 12303464000: MasTec, Inc.
192. $ 12288000000: THE LINCOLN NATIONAL LIFE INSURANCE COMPANY
193. $ 12278000000: THE AES CORPORATION
194. $ 12142000000: Westlake Corporation
195. $ 12100600000: AIR PRODUCTS AND CHEMICALS, INC.
196. $ 11933000000: MPLX LP
197. $ 11900809000: EVERSOURCE ENERGY
198. $ 11879653000: ENTERGY CORPORATION
199. $ 11877500000: Assurant, Inc.
200. $ 11789000000: AVIS BUDGET GROUP, INC.
201. $ 11695148000: RENAISSANCERE HOLDINGS LTD.
202. $ 11535000000: HUNTINGTON INGALLS INDUSTRIES, INC.
203. $ 11337000000: Cincinnati Financial Corporation
204. $ 11313853000: CHIPOTLE MEXICAN GRILL, INC.
205. $ 11303000000: Yum China Holdings, Inc.
206. $ 11298000000: LAS VEGAS SANDS CORP.
207. $ 11295654000: ULTA BEAUTY, INC.
208. $ 11257548000: THE ANDERSONS, INC.
209. $ 11198722000: PRUCO LIFE INSURANCE CO
210. $ 11174000000: Hilton Worldwide Holdings Inc.
211. $ 11122800000: Mosaic Co
212. $ 11066000000: Diamondback Energy, Inc.
213. $ 10691700000: INTERPUBLIC GROUP OF COMPANIES, INC.
214. $ 10634823000: BURLINGTON STORES, INC.
215. $ 10618037000: DISH DBS Corporation
216. $ 10524479000: NVR, Inc.
217. $ 10515069000: Jefferies Financial Group Inc.
218. $ 10503000000: Williams Companies, Inc.
219. $ 10481000000: EVEREST REINSURANCE HOLDINGS, INC.
220. $ 10290000000: Public Service Enterprise Group Incorporated
221. $ 10159020000: Golden Sun Health Technology Group Ltd
222. $ 10127200000: American Tower Corporation
223. $ 10085000000: NEWS CORPORATION
224. $ 10020000000: ICAHN ENTERPRISES L.P.
225. $  9930000000: WILLIS TOWERS WATSON PLC
226. $  9758000000: FIRST CITIZENS BANCSHARES INC /DE/
227. $  9699039000: A-Mark Precious Metals, Inc.
228. $  9675900000: BIOGEN INC.
229. $  9636000000: CAMPBELL SOUP CO
230. $  9503000000: American National Group Inc.
231. $  9382000000: EASTMAN CHEMICAL CO
232. $  9256000000: Zoetis Inc.
233. $  9177564000: Oscar Health, Inc.
234. $  9152000000: Ovintiv Inc.
235. $  9083300000: TechnipFMC plc
236. $  9049000000: HERTZ GLOBAL HOLDINGS, INC
237. $  8997000000: QVC, Inc.
238. $  8954417000: Altice USA, Inc.
239. $  8919591000: WASTE CONNECTIONS, INC.
240. $  8880000000: Shopify Inc.
241. $  8807000000: Graphic Packaging Holding Co
242. $  8704000000: Cheniere Energy Partners, L.P.
243. $  8652900000: PVH CORP.
244. $  8643000000: CenterPoint Energy, Inc.
245. $  8599900000: WEC ENERGY GROUP, INC.
246. $  8562000000: Xylem Inc.
247. $  8531034000: Blackstone Real Estate Income Trust, Inc.
248. $  8504000000: Sabine Pass Liquefaction, LLC
249. $  8462000000: PPL Corporation
250. $  8406000000: RESTAURANT BRANDS INTERNATIONAL INC.
251. $  8406000000: RESTAURANT BRANDS INTERNATIONAL LIMITED PARTNERSHIP
252. $  8324000000: AMERICAN FINANCIAL GROUP, INC.
253. $  8290400000: NORTHERN TRUST CORPORATION
254. $  8254000000: SOLVENTUM CORPORATION
255. $  8231500000: OLD REPUBLIC INTERNATIONAL CORPORATION
256. $  8201610000: Prologis, Inc.
257. $  8181000000: ALLY FINANCIAL INC.
258. $  8050000000: Voya Financial, Inc.
259. $  7996644000: AerCap Holdings N.V.
260. $  7991118000: WELLTOWER INC.
261. $  7940000000: TransDigm Group Incorporated
262. $  7922700000: POST HOLDINGS, INC.
263. $  7809000000: CITIZENS FINANCIAL GROUP INC/RI
264. $  7804746000: RUSH ENTERPRISES, INC.
265. $  7623000000: Ameren Corporation
266. $  7618317000: WATSCO, INC.
267. $  7610000000: CVR Energy, Inc
268. $  7549000000: YUM! BRANDS, INC.
269. $  7515000000: CMS ENERGY CORPORATION
270. $  7479000000: Science Applications International Corporation
271. $  7410078000: Knight-Swift Transportation Holdings Inc.
272. $  7377629000: CONTINENTAL RESOURCES, INC.
273. $  7302000000: Trip.com Group Limited
274. $  7295000000: GENWORTH FINANCIAL, INC.
275. $  7210000000: UGI CORP
276. $  7124000000: WEYERHAEUSER COMPANY
277. $  7110982000: Endeavor Group Holdings, Inc.
278. $  7027476000: Comfort Systems USA, Inc.
279. $  6827871000: ELBIT SYSTEMS LTD.
280. $  6783600000: Avantor, Inc.
281. $  6723700000: McCORMICK & COMPANY, INCORPORATED
282. $  6590231000: DILLARD’S, INC.
283. $  6568000000: CROWN CASTLE INC
284. $  6564028000: Coinbase Global, Inc.
285. $  6531000000: O-I GLASS, INC.
286. $  6496000000: LEVEL 3 PARENT, LLC
287. $  6403000000: Organon & Co.
288. $  6316600000: Spirit AeroSystems Holdings, Inc.
289. $  6237400000: HANOVER INSURANCE GROUP, INC.
290. $  6130100000: CME GROUP INC.
291. $  6128100000: FIRST AMERICAN FINANCIAL CORPORATION
292. $  6124900000: AMERICAN AXLE & MANUFACTURING HOLDINGS, INC
293. $  6036000000: Huntsman Corporation
294. $  5966072000: Ardent Health Partners, Inc.
295. $  5963798000: SIMON PROPERTY GROUP, INC.
296. $  5957651000: AXIS CAPITAL HOLDINGS LIMITED
297. $  5951686000: STIFEL FINANCIAL CORP
298. $  5937000000: FRONTIER COMMUNICATIONS PARENT, INC.
299. $  5936000000: CF INDUSTRIES HOLDINGS, INC.
300. $  5847300000: EVERGY, INC.
301. $  5786016000: Lyft, Inc.
302. $  5778069000: GLOBE LIFE INC.
303. $  5744000000: F&G Annuities & Life, Inc.
304. $  5692000000: Anywhere Real Estate Inc.
305. $  5639609434: INGLES MARKETS, INCORPORATED
306. $  5629100000: COMPASS, INC.
307. $  5554968000: DIGITAL REALTY TRUST, INC.
308. $  5508000000: QWEST CORPORATION
309. $  5475633000: MERCURY GENERAL CORP
310. $  5458000000: COTERRA ENERGY INC.
311. $  5425800000: Carlyle Group Inc.
312. $  5392600000: SEALED AIR CORP/DE
313. $  5377911000: Patterson-UTI Energy, Inc.
314. $  5377526000: ALBEMARLE CORPORATION
315. $  5341300000: LENNOX INTERNATIONAL INC.
316. $  5310953000: POOL CORPORATION
317. $  5305365000: SONOCO PRODUCTS COMPANY
318. $  5297529000: Cornerstone Building Brands, Inc.
319. $  5290500000: Schneider National, Inc.
320. $  5276000000: AXALTA COATING SYSTEMS LTD.
321. $  5273309000: EQT CORPORATION
322. $  5271142000: REALTY INCOME CORPORATION
323. $  5237100000: Brunswick Corporation
324. $  5205836000: Rithm Capital Corp.
325. $  5186802000: Harley-Davidson, Inc.
326. $  5129000000: EQUITABLE FINANCIAL LIFE INSURANCE COMPANY
327. $  5127000000: TEREX CORP
328. $  5124915000: PINNACLE WEST CAPITAL CORPORATION
329. $  5108400000: Snap-on Inc
330. $  5103487000: FLOWERS FOODS, INC
331. $  5053000000: TRINET GROUP, INC
332. $  5004989000: AMDOCS LIMITED
333. $  5003600000: CARLISLE COMPANIES INCORPORATED
334. $  4998202000: OPTION CARE HEALTH, INC.
335. $  4981000000: Hilton Grand Vacations Inc.
336. $  4979000000: KEYSIGHT TECHNOLOGIES, INC.
337. $  4967000000: Marriott Vacations Worldwide Corporation
338. $  4964000000: TELEPHONE AND DATA SYSTEMS, INC.
339. $  4948587000: Abercrombie & Fitch Co.
340. $  4940200000: DEERE JOHN CAPITAL CORP
341. $  4924266000: Ventas, Inc.
342. $  4880000000: Cheniere Corpus Christi Holdings, LLC
343. $  4861664000: SELECTIVE INSURANCE GROUP, INC.
344. $  4856215000: PUGET ENERGY INC /WA
345. $  4819245000: Landstar System, Inc.
346. $  4805000000: BROWN & BROWN, INC.
347. $  4745900000: Hasbro, Inc.
348. $  4724000000: Brighthouse Financial, Inc.
349. $  4709248000: AppLovin Corporation
350. $  4706416000: Domino’s Pizza, Inc.
351. $  4695616000: PUBLIC STORAGE
352. $  4638600000: Kemper Corporation
353. $  4638213000: MELCO RESORTS & ENTERTAINMENT LIMITED
354. $  4637200000: AMC ENTERTAINMENT HOLDINGS, INC.
355. $  4619000000: KeyCorp
356. $  4609000000: Fortune Brands Innovations, Inc.
357. $  4598700000: RYERSON HOLDING CORPORATION
358. $  4575000000: RIVERSOURCE LIFE INSURANCE COMPANY
359. $  4559652000: ALLIANCEBERNSTEIN L.P.
360. $  4504670000: M/I HOMES, INC.
361. $  4451606000: DREAM FINDERS HOMES, INC.
362. $  4449500000: CNO Financial Group, Inc.
363. $  4398288000: Century Communities, Inc.
364. $  4381000000: CATALENT, INC.
365. $  4325596000: ANTERO RESOURCES CORPORATION
366. $  4320564000: Upbound Group, Inc.
367. $  4315161000: Liberty Energy Inc.
368. $  4308200000: HYSTER-YALE, INC.
369. $  4284200000: RB Global, Inc
370. $  4280200000: FRESH DEL MONTE PRODUCE INC
371. $  4277000000: UNION CARBIDE CORPORATION
372. $  4236700000: PEABODY ENERGY CORP
373. $  4235000000: EXPAND ENERGY CORPORATION
374. $  4209700000: THE WESTERN UNION COMPANY
375. $  4206289000: First Solar, Inc.
376. $  4186379000: SERVICE CORPORATION INTERNATIONAL
377. $  4178000000: Skyworks Solutions, Inc.
378. $  4165187000: Atmos Energy Corp
379. $  4099700000: ASGN Inc
380. $  4030300000: HOLOGIC, INC
381. $  4014955000: Ciena Corp
382. $  3994000000: Cabot Corporation
383. $  3989800000: EURONET WORLDWIDE, INC.
384. $  3981000000: ALLIANT ENERGY CORP
385. $  3979900000: WISCONSIN ELECTRIC POWER COMPANY
386. $  3974589000: Corpay, Inc.
387. $  3973000000: Brighthouse Life Insurance Company
388. $  3872361000: Mettler-Toledo International Inc.
389. $  3866000000: VISTEON CORPORATION
390. $  3864000000: Travel & Leisure Co.
391. $  3857669000: HEICO CORPORATION
392. $  3854532000: IHEARTMEDIA, INC.
393. $  3849205000: VICI Properties Inc.
394. $  3823000000: GameStop Corp.
395. $  3770000000: UNITED STATES CELLULAR CORPORATION
396. $  3751100000: Diebold Nixdorf, Incorporated
397. $  3747000000: HSBC USA Inc.
398. $  3741208000: LCI INDUSTRIES
399. $  3698652000: FTI CONSULTING, INC.
400. $  3690668000: ARES MANAGEMENT CORPORATION
401. $  3633983000: ChampionX Corp
402. $  3630700000: ITT INC.
403. $  3609160000: MOOG Inc.
404. $  3605223000: WESTERN MIDSTREAM PARTNERS, LP
405. $  3582890000: AptarGroup, Inc.
406. $  3568000000: HERC HOLDINGS INC.
407. $  3566324000: Advantage Solutions Inc.
408. $  3548000000: Sinclair, Inc.
409. $  3544700000: THE GREENBRIER COMPANIES, INC.
410. $  3504981000: Matador Resources Company
411. $  3500082000: TPG Inc.
412. $  3489000000: CATERPILLAR FINANCIAL SERVICES CORPORATION
413. $  3479373000: Match Group, Inc.
414. $  3475000000: Garrett Motion Inc.
415. $  3440000000: PORTLAND GENERAL ELECTRIC COMPANY
416. $  3407719000: BXP, INC.
417. $  3388514000: FIRSTCASH HOLDINGS, INC.
418. $  3356000000: CONDUENT INC
419. $  3291856000: Cimpress plc
420. $  3274000000: H World Group Ltd
421. $  3271000000: Jackson Financial Inc.
422. $  3268800000: IDEX CORP
423. $  3260300000: Aspen Insurance Holdings Limited
424. $  3256902000: EXTRA SPACE STORAGE INC.
425. $  3221100000: SUN COMMUNITIES, INC
426. $  3219850000: Hawaiian Electric Industries, Inc.
427. $  3209074000: Saia, Inc.
428. $  3200460000: CENTRAL GARDEN & PET CO
429. $  3198000000: California Resources Corp
430. $  3190000000: FIRST HORIZON CORP
431. $  3182800000: HILLENBRAND, INC.
432. $  3166000000: STEELCASE INC
433. $  3160064000: Dingdong (Cayman) Limited
434. $  3139904000: LAZARD, INC.
435. $  3089143000: Primerica, Inc
436. $  3079200000: TRINITY INDUSTRIES INC
437. $  3030258000: WERNER ENTERPRISES, INC.
438. $  3028474000: MURPHY OIL CORPORATION
439. $  3009262000: DESIGNER BRANDS INC.
440. $  3004918000: HOVNANIAN ENTERPRISES INC
441. $  2996361000: EVERCORE INC.
442. $  2985300000: OGE ENERGY CORP.
443. $  2957285000: ALPHA METALLURGICAL RESOURCES, INC.
444. $  2951000000: Robinhood Markets, Inc.
445. $  2941000000: LOUISIANA-PACIFIC CORPORATION
446. $  2937587000: Vishay Intertechnology, Inc.
447. $  2913757000: AVALONBAY COMMUNITIES, INC.
448. $  2899005000: Knife River Corporation
449. $  2895000000: EQUITABLE FINANCIAL LIFE INSURANCE COMPANY OF AMERICA
450. $  2885191000: Vail Resorts, Inc.
451. $  2884358000: IES Holdings, Inc.
452. $  2876949000: Virtu Financial, Inc.
453. $  2841216000: Stagwell Inc.
454. $  2819880000: TERADYNE, INC.
455. $  2804341000: TKO GROUP HOLDINGS, INC.
456. $  2782900000: QUIDELORTHO CORP
457. $  2756607000: HELMERICH & PAYNE, INC.
458. $  2740803000: ESAB CORPORATION
459. $  2738502000: NEWMARK GROUP, INC.
460. $  2735272000: NICE LTD.
461. $  2733657000: AIR LEASE CORPORATION
462. $  2708926000: Six Flags Entertainment Corporation/NEW
463. $  2703561000: ALIGNMENT HEALTHCARE, INC.
464. $  2702122000: TITAN MACHINERY INC.
465. $  2700449000: Healthpeak Properties, Inc.
466. $  2700400000: MasterBrand, Inc.
467. $  2690259000: SM ENERGY CO
468. $  2679634000: SBA COMMUNICATIONS CORPORATION
469. $  2666541000: AMERICOLD REALTY TRUST, INC.
470. $  2661161000: OCEANEERING INTERNATIONAL INC
471. $  2657800000: Enova International, Inc.
472. $  2656105000: BENCHMARK ELECTRONICS, INC.
473. $  2648000000: VOYA RETIREMENT INSURANCE & ANNUITY CO
474. $  2628100000: WEX INC.
475. $  2618942000: Invitation Homes Inc.
476. $  2603800000: SIRIUSPOINT LTD.
477. $  2590286000: WEBSTER FINANCIAL CORPORATION
478. $  2569900000: Arcosa, Inc.
479. $  2565000000: CHECK POINT SOFTWARE TECHNOLOGIES LTD.
480. $  2544809000: ANSYS, Inc.
481. $  2526000000: TAMPA ELECTRIC COMPANY
482. $  2519355000: GLOBUS MEDICAL, INC.
483. $  2515710000: RYAN SPECIALTY HOLDINGS, INC.
484. $  2512589000: Allegiant Travel Co
485. $  2512000000: INTERNATIONAL GAME TECHNOLOGY PLC
486. $  2507713000: Coronado Global Resources Inc.
487. $  2490419000: STEWART INFORMATION SERVICES CORP
488. $  2463496000: PROG HOLDINGS, INC.
489. $  2460979000: BELDEN INC.
490. $  2458796000: GREEN PLAINS INC.
491. $  2431287000: CHEMED CORPORATION
492. $  2420000000: FIDELIS INSURANCE HOLDINGS LIMITED
493. $  2417084000: RANGE RESOURCES CORPORATION
494. $  2395718000: WILLSCOT HOLDINGS CORPORATION
495. $  2382046000: ICU MEDICAL INC/DE
496. $  2364860000: New Fortress Energy Inc.
497. $  2362600000: Valaris Limited
498. $  2348324000: AMEDISYS, INC.
499. $  2342645000: ENVIRI CORPORATION
500. $  2339588000: Driven Brands Holdings Inc.