USAspending API in Python#
by Michael T. Moen
Please see the following resources for more information on API usage:
Documentation
Terms
Data Reuse
These recipe examples were tested on May 5, 2025.
Setup#
The following external libraries need to be installed into your environment to run the code examples in this tutorial:
We import the libraries used in this tutorial below:
import requests
import matplotlib.pyplot as plt
import numpy as np
1. Get Agency Names and Toptier Codes#
To obtain data from the API, it is useful to first build a dictionary containing agency names and toptier codes, the latter of which will be used to access subagency data. The toptier codes serve as unique identifiers for each agency, so they are needed for accessing some of the data in the API.
BASE_URL = "https://api.usaspending.gov/api/v2/"
toptier_agencies_endpoint = "references/toptier_agencies/"

# Import data from URL as a JSON file
toptier_response = requests.get(BASE_URL + toptier_agencies_endpoint)

# Response code of 200 indicates success
toptier_response.status_code
200
toptier_data = toptier_response.json()["results"]

# Print number of agencies
len(toptier_data)
109
# Display data of first agency
toptier_data[0]
{'agency_id': 1525,
 'toptier_code': '247',
 'abbreviation': 'AAHC',
 'agency_name': '400 Years of African-American History Commission',
 'congressional_justification_url': None,
 'active_fy': '2025',
 'active_fq': '2',
 'outlay_amount': 1773589.26,
 'obligated_amount': 7217.52,
 'budget_authority_amount': 2919754.67,
 'current_total_budget_authority_amount': 14651831778670.89,
 'percentage_of_total_budget_authority': 1.9927574340911925e-07,
 'agency_slug': '400-years-of-african-american-history-commission'}
Now we can create a dictionary containing the agency names as keys and the toptier codes as the data.
# Compile dictionary containing agency names and toptier codes
toptier_codes = {record["agency_name"] : record["toptier_code"] for record in toptier_data}

# Display data
toptier_codes
{'400 Years of African-American History Commission': '247',
 'Access Board': '310',
 'Administrative Conference of the U.S.': '302',
 'Advisory Council on Historic Preservation': '306',
 'African Development Foundation': '166',
 'Agency for International Development': '072',
 'American Battle Monuments Commission': '074',
 'Appalachian Regional Commission': '309',
 'Armed Forces Retirement Home': '084',
 'Barry Goldwater Scholarship and Excellence In Education Foundation': '313',
 "Commission for the Preservation of America's Heritage Abroad": '321',
 'Commission of Fine Arts': '323',
 'Commission on Civil Rights': '326',
 'Committee for Purchase from People Who Are Blind or Severely Disabled': '338',
 'Commodity Futures Trading Commission': '339',
 'Consumer Financial Protection Bureau': '581',
 'Consumer Product Safety Commission': '061',
 'Corporation for National and Community Service': '485',
 'Corps of Engineers - Civil Works': '096',
 'Council of the Inspectors General on Integrity and Efficiency': '542',
 'Court Services and Offender Supervision Agency': '9553',
 'Defense Nuclear Facilities Safety Board': '347',
 'Delta Regional Authority': '517',
 'Denali Commission': '513',
 'Department of Agriculture': '012',
 'Department of Commerce': '013',
 'Department of Defense': '097',
 'Department of Education': '091',
 'Department of Energy': '089',
 'Department of Health and Human Services': '075',
 'Department of Homeland Security': '070',
 'Department of Housing and Urban Development': '086',
 'Department of Justice': '015',
 'Department of Labor': '1601',
 'Department of State': '019',
 'Department of Transportation': '069',
 'Department of Veterans Affairs': '036',
 'Department of the Interior': '014',
 'Department of the Treasury': '020',
 'District of Columbia Courts': '349',
 'Election Assistance Commission': '525',
 'Environmental Protection Agency': '068',
 'Equal Employment Opportunity Commission': '045',
 'Executive Office of the President': '1100',
 'Export-Import Bank of the United States': '083',
 'Farm Credit System Insurance Corporation': '7802',
 'Federal Communications Commission': '027',
 'Federal Deposit Insurance Corporation': '051',
 'Federal Election Commission': '360',
 'Federal Financial Institutions Examination Council': '362',
 'Federal Labor Relations Authority': '054',
 'Federal Maritime Commission': '065',
 'Federal Mediation and Conciliation Service': '093',
 'Federal Mine Safety and Health Review Commission': '368',
 'Federal Permitting Improvement Steering Council': '473',
 'Federal Trade Commission': '029',
 'General Services Administration': '047',
 'Government Accountability Office': '005',
 'Gulf Coast Ecosystem Restoration Council': '471',
 'Harry S Truman Scholarship Foundation': '372',
 'Institute of Museum and Library Services': '474',
 'Inter-American Foundation': '164',
 'International Trade Commission': '034',
 'James Madison Memorial Fellowship Foundation': '381',
 'Japan-United States Friendship Commission': '382',
 'John F. Kennedy Center for the Performing Arts': '3301',
 'Marine Mammal Commission': '387',
 'Merit Systems Protection Board': '389',
 'Millennium Challenge Corporation': '524',
 'Morris K. Udall and Stewart L. Udall Foundation': '487',
 'National Aeronautics and Space Administration': '080',
 'National Archives and Records Administration': '088',
 'National Capital Planning Commission': '394',
 'National Council on Disability': '413',
 'National Credit Union Administration': '025',
 'National Endowment for the Arts': '417',
 'National Endowment for the Humanities': '418',
 'National Labor Relations Board': '420',
 'National Mediation Board': '421',
 'National Science Foundation': '049',
 'National Transportation Safety Board': '424',
 'Northern Border Regional Commission': '573',
 'Nuclear Regulatory Commission': '031',
 'Nuclear Waste Technical Review Board': '431',
 'Occupational Safety and Health Review Commission': '432',
 'Office of Government Ethics': '434',
 'Office of Navajo and Hopi Indian Relocation': '435',
 'Office of Personnel Management': '024',
 'Office of Special Counsel': '062',
 'Overseas Private Investment Corporation': '071',
 'Patient-Centered Outcomes Research Trust Fund': '579',
 'Peace Corps': '1125',
 'Pension Benefit Guaranty Corporation': '1602',
 'Presidio Trust': '512',
 'Privacy and Civil Liberties Oversight Board': '535',
 'Public Buildings Reform Board': '290',
 'Railroad Retirement Board': '060',
 'Securities and Exchange Commission': '050',
 'Selective Service System': '090',
 'Small Business Administration': '073',
 'Social Security Administration': '028',
 'Surface Transportation Board': '472',
 'U.S. Agency for Global Media': '514',
 'U.S. Interagency Council on Homelessness': '376',
 'U.S. International Development Finance Corporation': '077',
 'United States Chemical Safety Board': '510',
 'United States Court of Appeals for Veterans Claims': '345',
 'United States Trade and Development Agency': '1133',
 'Vietnam Education Foundation': '519'}
Finally, let’s print the toptier code for a particular agency using the toptier_codes dictionary we built. This will be useful when building URLs to view other data from the API.
toptier_codes["Department of Transportation"]
'069'
With this information, we can access subagency data using the toptier codes.
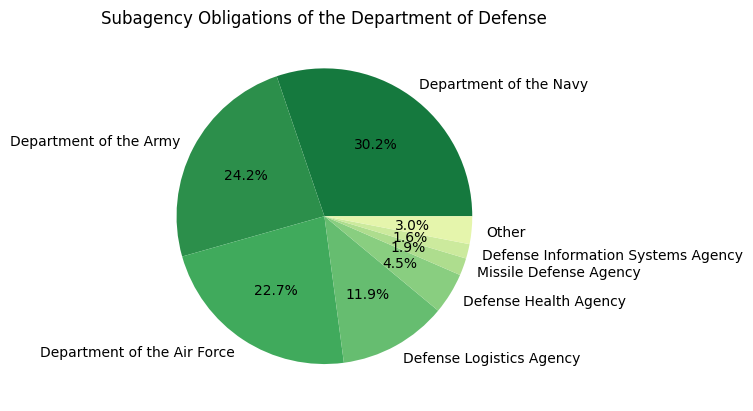
2. Retrieving Data from Subagencies#
The toptier_codes dictionary we created above contains every agency name in the API. For this example, we’ll look at the total obligations of each subagency of the Department of Defense.
# Set this to the desired department
agency_name = 'Department of Defense'

dod_url = f"{BASE_URL}agency/{toptier_codes[agency_name]}/sub_agency/"
params = {
    'fiscal_year': 2024
}

dod_response = requests.get(dod_url, params=params)

# Status code 200 indicates success
dod_response.status_code
200
# Extract data from HTTP response
dod_data = dod_response.json()['results']

# Define dictionary with subagency names as keys and total_obligations as the data
dod_subagencies = {data['name']: data['total_obligations'] for data in dod_data}

dod_subagencies
{'Department of the Navy': 135174201255.6,
 'Department of the Army': 108068852362.25,
 'Department of the Air Force': 101546786153.31,
 'Defense Logistics Agency': 53055966604.09,
 'Defense Health Agency': 20211030486.08,
 'Missile Defense Agency': 8449104369.2,
 'Defense Information Systems Agency': 7104135597.93,
 'USTRANSCOM': 5249039584.72,
 'U.S. Special Operations Command': 4902029625.0,
 'Washington Headquarters Services': 3403051572.15}
We’ll represent our data using a pie chart. To make the data easier to read, we can create an “Other” category for smaller subagencies.
subagency_names = list(dod_subagencies.keys())
subagency_obligations = list(dod_subagencies.values())

threshold = 0.015 # Sectors under this value are combined into an "Other" category in the chart
total_obligations = sum(dod_subagencies.values()) # the total obligations of the agency

# Count the number of slices below the threshold
small_slices = sum(1 for i in subagency_obligations if i < threshold * total_obligations)

# If multiple slices are under the threshold, combine the slices into an "Other" slice
if small_slices > 1:
    other_obligations = 0
    i = len(subagency_obligations) - 1
    while i >= 0:
        if subagency_obligations[i] < threshold * total_obligations:
            other_obligations += subagency_obligations[i]
            subagency_names.pop(i)
            subagency_obligations.pop(i)
        i -= 1
    subagency_obligations.append(other_obligations)
    subagency_names.append("Other")

# Configure color of pie chart
cmap = plt.get_cmap('YlGn_r')
colors = cmap(np.linspace(0.2, 0.8, len(subagency_obligations)))

fig, ax = plt.subplots()
plt.pie(subagency_obligations, labels=subagency_names, autopct='%1.1f%%', colors=colors)
plt.title(f"Subagency Obligations of the {agency_name}")

plt.show()
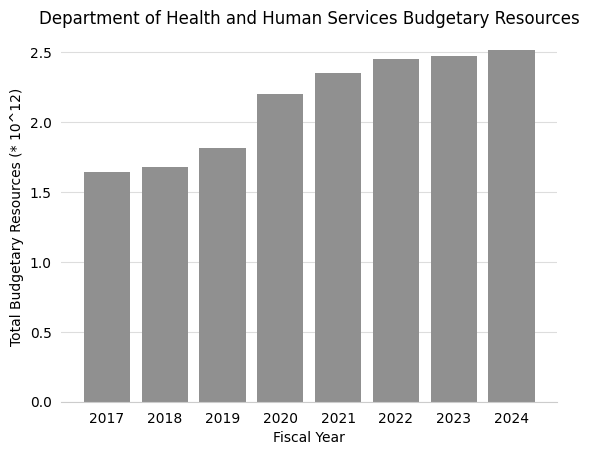
3. Accessing Fiscal Data Per Year#
We can use the API to examine the annual budget of an agency from 2017 onward.
agency_name = "Department of Health and Human Services"

hhs_url = f"{BASE_URL}agency/{toptier_codes[agency_name]}/budgetary_resources/"

hhs_response = requests.get(hhs_url)

# Status code 200 indicates sucess
hhs_response.status_code
200
hhs_data = hhs_response.json()["agency_data_by_year"]

# Number of years contained in the data
len(hhs_data)
9
Now we can create a dictionary to store the budgets using the years as keys.
# Create dictionary with fiscal_year as the key and agency_total_obligated as the data
budget_by_year = {item['fiscal_year'] : item['agency_total_obligated'] for item in hhs_data}

# Print results
budget_by_year
{2025: 1367556553152.74,
 2024: 2518647728970.53,
 2023: 2475673980552.7,
 2022: 2452969781323.39,
 2021: 2355524286884.46,
 2020: 2198882208891.79,
 2019: 1814270463757.37,
 2018: 1679128003253.74,
 2017: 1646989531123.68}
The budget data for the current year (2025 at the time of writing) does not contain the entire annual budget, so let’s remove that entry from the data.
budget_by_year.pop(2025)

# Print updated dictionary
budget_by_year
{2024: 2518647728970.53,
 2023: 2475673980552.7,
 2022: 2452969781323.39,
 2021: 2355524286884.46,
 2020: 2198882208891.79,
 2019: 1814270463757.37,
 2018: 1679128003253.74,
 2017: 1646989531123.68}
Now we’ll use matplotlib to create a bar graph for this information.
lists = sorted(budget_by_year.items())
years, budgets = zip(*lists)

# Create scale for bar graph
min = sorted(list(budgets), key=float)[0]
exponent = len(str(int(min)))-1

budgets = [x/(10**exponent) for x in budgets]

fig, ax = plt.subplots()

# Format the bar graph
ax.spines['top'].set_visible(False)
ax.spines['right'].set_visible(False)
ax.spines['left'].set_visible(False)
ax.spines['bottom'].set_color('#CCCCCC')
ax.tick_params(bottom=False, left=False)
ax.set_axisbelow(True)
ax.yaxis.grid(True, color='#DDDDDD')
ax.xaxis.grid(False)

plt.bar(years, budgets, color='#909090')
plt.title(agency_name + " Budgetary Resources")
plt.xlabel("Fiscal Year")
plt.ylabel(f"Total Budgetary Resources (* 10^{exponent})")
plt.show()
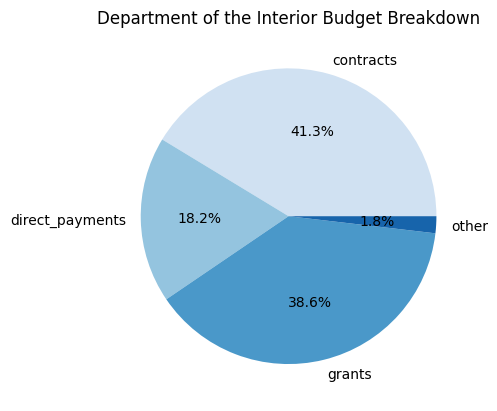
4. Breaking Down Budget Categories#
We can use the API to view the breakdown the spending of a particular agency.
agency_name = "Department of the Interior"

doi_url = f"{BASE_URL}agency/{toptier_codes[agency_name]}/obligations_by_award_category/"
params = {
    'fiscal_year': 2023
}

doi_response = requests.get(doi_url, params=params)

# Status code 200 indicates success
doi_response.status_code
200
# Extract data from HTTP response
doi_data = doi_response.json()
aggregated_total = doi_data["total_aggregated_amount"]
obligations_data = doi_data["results"]

# Print results
obligations_data
[{'category': 'contracts', 'aggregated_amount': 7639774240.23},
 {'category': 'direct_payments', 'aggregated_amount': 3363870101.97},
 {'category': 'grants', 'aggregated_amount': 7146409904.93},
 {'category': 'idvs', 'aggregated_amount': 3579835.81},
 {'category': 'loans', 'aggregated_amount': 0.0},
 {'category': 'other', 'aggregated_amount': 338002603.98}]
Let’s create a dictionary to store this data.
budget_breakdown = {}

# Add entry to budget_breakdown dictionary only if the amount is greater than zero
for record in obligations_data:
    if record["aggregated_amount"] > 0:
        budget_breakdown[record["category"]] = record["aggregated_amount"]

budget_breakdown
{'contracts': 7639774240.23,
 'direct_payments': 3363870101.97,
 'grants': 7146409904.93,
 'idvs': 3579835.81,
 'other': 338002603.98}
In order to graph the data, we have to reformat and filter out some of our data:
threshold = 0.02 # any sector under this threshold will be combined into an "other" category

# Count the number of small slices
small_slices = sum(1 for i in budget_breakdown.values() if threshold > i/aggregated_total)

if small_slices > 1:

    keys_to_remove = []

    for key, value in budget_breakdown.items():
        if key == 'other' or threshold < value/aggregated_total:
            continue
        if 'other' not in budget_breakdown.keys():
            budget_breakdown['other'] = 0
        budget_breakdown['other'] += value
        keys_to_remove.append(key)

    for key in keys_to_remove:
        budget_breakdown.pop(key)

budget_type = list(budget_breakdown.keys())
budget_amount = list(budget_breakdown.values())
budget_percentages = [x/aggregated_total for x in budget_amount]
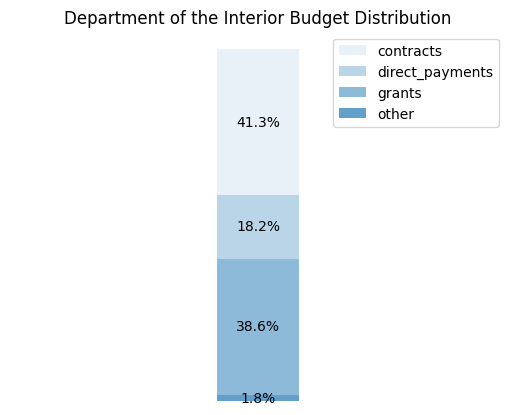
Now, we can graph the data with a stacked bar chart:
fig, ax = plt.subplots()
bottom = 1

for j, (height, label) in enumerate([*zip(budget_percentages, budget_type)]):
    bottom -= height
    bc = ax.bar(0,
                height=height,
                label=label,
                width=2,
                bottom=bottom,
                alpha=0.1 + 0.2 * j,
                align='center',
                color='C0')
    ax.bar_label(bc, labels=[f"{height:.1%}"], label_type='center')

ax.set_title(f'{agency_name} Budget Distribution')
ax.legend()
ax.axis('off')
ax.set_xlim(-6, 6)

plt.show()
We can also plot this data as a pie chart.
lists = sorted(budget_breakdown.items())
types, budgets = zip(*lists)

fig, ax = plt.subplots()

# Configure color of pie chart
cmap = plt.get_cmap('Blues')
colors = cmap(np.linspace(0.2, 0.8, len(budgets)))

plt.pie(budgets, labels=types, autopct='%1.1f%%', colors=colors)
plt.title(f"{agency_name} Budget Breakdown")
plt.show()