National Weather Service (NWS) API in Python#
by Michael T. Moen
Please see the following resources for more information on API usage:
Documentation
Terms of Use
From the documentation, “All of the information presented via the API is intended to be open data, free to use for any purpose.”
NOTE: The NWS API imposes a rate limit on requests, but the amount is not published. We recommend using a 1 second delay between API requests.
These recipe examples were tested on March 20, 2025.
Warning
Example use-cases and result outputs shown are for demonstration purposes only. The displayed results are for a specific example location and are not current. For live and up-to-date weather data, conditions, forecasts, and alerts in U.S. locations, visit the National Weather Service website.
Setup#
Import Libraries#
The following external libraries need to be installed into your environment to run the code examples in this tutorial:
We import the libraries used in this tutorial below:
import os
import requests
import matplotlib.pyplot as plt
import matplotlib.dates as mdates
from time import sleep
from dateutil import parser
from dotenv import load_dotenv
Import User-Agent#
An User Agent is required to access the NWS API.
We keep our User Agent in a .env file and use the dotenv library to access it. If you would like to use this method, create a file named .env in the same directory as this notebook and add the following line to it:
NWS_USER_AGENT="Application Name, email@domain.com"
load_dotenv()
try:
    USER_AGENT = {"User-Agent": os.environ["NWS_USER_AGENT"]}
except KeyError:
    print("User-Agent key not found. Please set 'NWS_USER_AGENT' in your .env file.")
1. Get the 12-Hour Forecast for a Location#
Warning
Example use-cases and result outputs shown are for demonstration purposes only. The displayed results are for a specific example location and are not current. For live and up-to-date weather data, conditions, forecasts, and alerts in U.S. locations, visit the National Weather Service website.
The NWS publishes weather forecasts for each of its Weather Forecast Offices. A map of these offices and the regions they cover can be found here.
In order to obtain the forecast for a location, we must query that region’s Weather Forecast Office using its code and the grid coordinates of the location. To determine these values for a location, we can query the /points endpoint.
To see how to programmatically obtain the latititude and longitude of an address in the U.S., please see our U.S. Census Geocoding cookbook tutorials.
latitude = '33.211952'
longitude = '-87.545920'

url = f'https://api.weather.gov/points/{latitude},{longitude}'
response = requests.get(url, headers=USER_AGENT).json()

# Display response from API
response
{'@context': ['https://geojson.org/geojson-ld/geojson-context.jsonld',
  {'@version': '1.1',
   'wx': 'https://api.weather.gov/ontology#',
   's': 'https://schema.org/',
   'geo': 'http://www.opengis.net/ont/geosparql#',
   'unit': 'http://codes.wmo.int/common/unit/',
   '@vocab': 'https://api.weather.gov/ontology#',
   'geometry': {'@id': 's:GeoCoordinates', '@type': 'geo:wktLiteral'},
   'city': 's:addressLocality',
   'state': 's:addressRegion',
   'distance': {'@id': 's:Distance', '@type': 's:QuantitativeValue'},
   'bearing': {'@type': 's:QuantitativeValue'},
   'value': {'@id': 's:value'},
   'unitCode': {'@id': 's:unitCode', '@type': '@id'},
   'forecastOffice': {'@type': '@id'},
   'forecastGridData': {'@type': '@id'},
   'publicZone': {'@type': '@id'},
   'county': {'@type': '@id'}}],
 'id': 'https://api.weather.gov/points/33.212,-87.5459',
 'type': 'Feature',
 'geometry': {'type': 'Point', 'coordinates': [-87.5459, 33.212]},
 'properties': {'@id': 'https://api.weather.gov/points/33.212,-87.5459',
  '@type': 'wx:Point',
  'cwa': 'BMX',
  'forecastOffice': 'https://api.weather.gov/offices/BMX',
  'gridId': 'BMX',
  'gridX': 33,
  'gridY': 69,
  'forecast': 'https://api.weather.gov/gridpoints/BMX/33,69/forecast',
  'forecastHourly': 'https://api.weather.gov/gridpoints/BMX/33,69/forecast/hourly',
  'forecastGridData': 'https://api.weather.gov/gridpoints/BMX/33,69',
  'observationStations': 'https://api.weather.gov/gridpoints/BMX/33,69/stations',
  'relativeLocation': {'type': 'Feature',
   'geometry': {'type': 'Point', 'coordinates': [-87.5283, 33.234404]},
   'properties': {'city': 'Tuscaloosa',
    'state': 'AL',
    'distance': {'unitCode': 'wmoUnit:m', 'value': 2981.0037391988},
    'bearing': {'unitCode': 'wmoUnit:degree_(angle)', 'value': 213}}},
  'forecastZone': 'https://api.weather.gov/zones/forecast/ALZ023',
  'county': 'https://api.weather.gov/zones/county/ALC125',
  'fireWeatherZone': 'https://api.weather.gov/zones/fire/ALZ023',
  'timeZone': 'America/Chicago',
  'radarStation': 'KBMX'}}
office = response["properties"]["gridId"]
gridX = response["properties"]["gridX"]
gridY = response["properties"]["gridY"]

# Print grid location data
print(f'Office code: {office}, Grid coordinates: {gridX}, {gridY}')
Office code: BMX, Grid coordinates: 33, 69
Now that we have obtained the grid coordinates and office code, we can use the /gridpoints endpoint to obtain the seven day forecast (output data is for a specific location and is not current; visit the National Weather Service website for up-to-date information).
url = f'https://api.weather.gov/gridpoints/{office}/{gridX},{gridY}/forecast'
response = requests.get(url, headers=USER_AGENT).json()

# Display first result
response["properties"]["periods"][0]
{'number': 1,
 'name': 'Today',
 'startTime': '2025-03-21T11:00:00-05:00',
 'endTime': '2025-03-21T18:00:00-05:00',
 'isDaytime': True,
 'temperature': 67,
 'temperatureUnit': 'F',
 'temperatureTrend': '',
 'probabilityOfPrecipitation': {'unitCode': 'wmoUnit:percent', 'value': None},
 'windSpeed': '0 to 10 mph',
 'windDirection': 'SW',
 'icon': 'https://api.weather.gov/icons/land/day/skc?size=medium',
 'shortForecast': 'Sunny',
 'detailedForecast': 'Sunny, with a high near 67. Southwest wind 0 to 10 mph.'}
Finally, we can print the data we are interested in. In this case, we’re looking at the temperature, probability of precipitation, and detailed forecast (output data is for a specific location and is not current; visit the National Weather Service website for up-to-date information.).
for day in response["properties"]["periods"]:
    name = day["name"]
    temperature = day["temperature"]
    rain = day["probabilityOfPrecipitation"]["value"] or 0
    forecast = day["detailedForecast"]
    print(f'{name:<16}: {temperature:>3}F, {rain:>3}%, {forecast}')
Today           :  67F,   0%, Sunny, with a high near 67. Southwest wind 0 to 10 mph.
Tonight         :  41F,   0%, Mostly clear, with a low around 41. South wind around 5 mph.
Saturday        :  76F,   0%, Sunny, with a high near 76. West wind 5 to 10 mph.
Saturday Night  :  50F,   0%, Clear, with a low around 50. South wind 0 to 5 mph.
Sunday          :  79F,   0%, Sunny, with a high near 79. South wind 5 to 15 mph, with gusts as high as 30 mph.
Sunday Night    :  56F, 100%, Showers and thunderstorms after 7pm. Mostly cloudy, with a low around 56. Chance of precipitation is 100%.
Monday          :  72F, 100%, Showers and thunderstorms before 7am, then a slight chance of showers and thunderstorms between 7am and 1pm. Partly sunny, with a high near 72. Chance of precipitation is 100%.
Monday Night    :  46F,   0%, Partly cloudy, with a low around 46.
Tuesday         :  78F,   0%, Sunny, with a high near 78.
Tuesday Night   :  51F,   0%, Mostly clear, with a low around 51.
Wednesday       :  76F,   0%, Sunny, with a high near 76.
Wednesday Night :  48F,   0%, Mostly clear, with a low around 48.
Thursday        :  76F,   0%, Sunny, with a high near 76.
Thursday Night  :  52F,   0%, Partly cloudy, with a low around 52.
2. Get the Hourly Forecast for a Location#
Warning
Example use-cases and result outputs shown are for demonstration purposes only. The displayed results are for a specific example location and are not current. For live and up-to-date weather data, conditions, forecasts, and alerts in U.S. locations, visit the National Weather Service website.
The /gridpoints endpoint can also return an hourly forecast for a seven day period. The function below implements the code from the example above using this hourly forecast method:
# Note that this function only works with valid latitude and longitude inputs
def getHourlyForecast(latitude, longitude, user_agent):
    points_data = requests.get(
        f'https://api.weather.gov/points/{latitude},{longitude}',
        headers=user_agent
    ).json()
    office = points_data["properties"]["gridId"]
    gridX = points_data["properties"]["gridX"]
    gridY = points_data["properties"]["gridY"]

    sleep(1)    # Add 1 second delay between API requests

    # The "/hourly" is the only difference between the hourly and daily forecast URLs
    gridpoints_data = requests.get(
        f'https://api.weather.gov/gridpoints/{office}/{gridX},{gridY}/forecast/hourly',
        headers=user_agent
    ).json()
    return gridpoints_data["properties"]["periods"]
The function can be easily used as such:
latitude = '33.211952'
longitude = '-87.545920'
hourlyForecast = getHourlyForecast(latitude, longitude, USER_AGENT)
len(hourlyForecast)
156
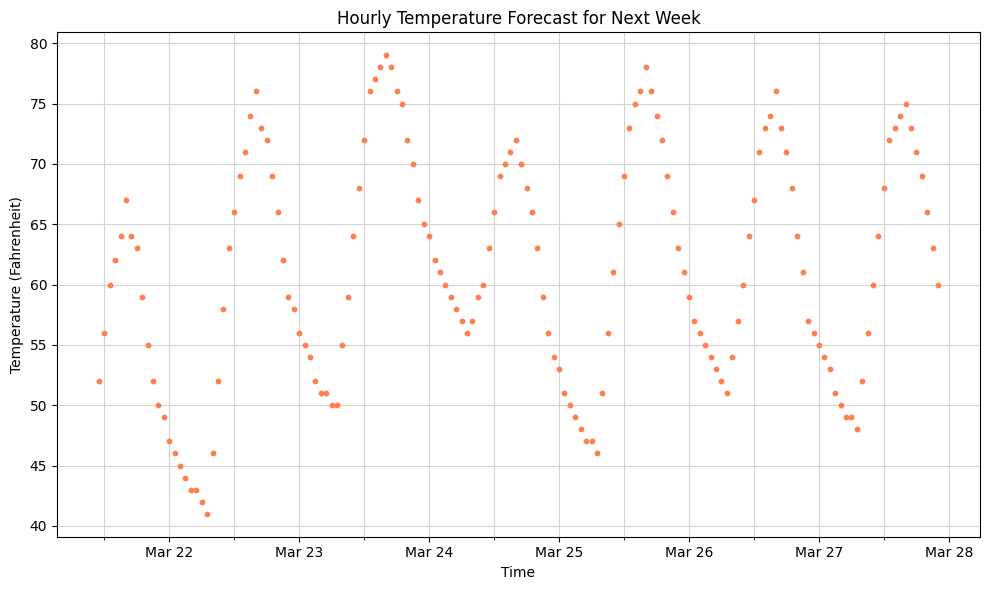
Lastly, we can use matplotlib to graph the temperature data (output data is for a specific location and is not current; visit the National Weather Service website for up-to-date information).
hours = []
temperatures = []
for hourForecast in hourlyForecast:
    hour = parser.parse(hourForecast["startTime"][:19])
    hours.append(hour)
    temperatures.append(hourForecast["temperature"])

plt.figure(figsize=(10, 6))
plt.scatter(hours, temperatures, color='coral', marker='o', s=10)
plt.title('Hourly Temperature Forecast for Next Week')
plt.xlabel('Time')
plt.ylabel('Temperature (Fahrenheit)')
plt.grid(True, which='both', color='lightgray')
plt.gca().set_axisbelow(True)
plt.gca().xaxis.set_major_locator(mdates.HourLocator(byhour=0))
plt.gca().xaxis.set_major_formatter(mdates.DateFormatter('%b %d'))
plt.gca().xaxis.set_minor_locator(mdates.HourLocator(byhour=12))
plt.gca().xaxis.set_minor_formatter(mdates.DateFormatter(''))
plt.tight_layout()
plt.show()
3. Get Alerts for a Location#
Warning
Example use-cases and result outputs shown are for demonstration purposes only. The displayed results are for a specific example location and are not current. For live and up-to-date weather data, conditions, forecasts, and alerts in U.S. locations, visit the National Weather Service website.
The /alerts endpoint returns all alerts issued for a given location or area. The example below uses the point parameter to find all alerts for a pair of coordinates:
latitude = '33.211952'
longitude = '-87.545920'

url = f'https://api.weather.gov/alerts/active?point={latitude},{longitude}'
response = requests.get(url, headers=USER_AGENT).json()

# Display response from API
response
{'@context': {'@version': '1.1'},
 'type': 'FeatureCollection',
 'features': [],
 'title': 'Current watches, warnings, and advisories for 33.211952 N, 87.54592 W',
 'updated': '2025-03-21T14:00:00+00:00'}
Note that in the example above, there are no active alerts (output data is for a specific location and is not current; visit the National Weather Service website for up-to-date information).
The example below uses the area parameter to find alerts for the state of Alabama:
state = 'AL'

url = f'https://api.weather.gov/alerts/active?area={state}'
response = requests.get(url, headers=USER_AGENT).json()

# Display response from API
response['features'][0]
{'id': 'https://api.weather.gov/alerts/urn:oid:2.49.0.1.840.0.81bdc5cba392ccdc980a3772eaa6b40432383b93.001.1',
 'type': 'Feature',
 'geometry': {'type': 'Polygon',
  'coordinates': [[[-88.05, 32.31],
    [-87.91, 32.32],
    [-88.09, 31.78],
    [-88.04, 31.6],
    [-88.10000000000001, 31.6],
    [-88.22000000000001, 31.78],
    [-88.05, 32.31]]]},
 'properties': {'@id': 'https://api.weather.gov/alerts/urn:oid:2.49.0.1.840.0.81bdc5cba392ccdc980a3772eaa6b40432383b93.001.1',
  '@type': 'wx:Alert',
  'id': 'urn:oid:2.49.0.1.840.0.81bdc5cba392ccdc980a3772eaa6b40432383b93.001.1',
  'areaDesc': 'Choctaw, AL; Clarke, AL; Washington, AL',
  'geocode': {'SAME': ['001023', '001025', '001129'],
   'UGC': ['ALC023', 'ALC025', 'ALC129']},
  'affectedZones': ['https://api.weather.gov/zones/county/ALC023',
   'https://api.weather.gov/zones/county/ALC025',
   'https://api.weather.gov/zones/county/ALC129'],
  'references': [{'@id': 'https://api.weather.gov/alerts/urn:oid:2.49.0.1.840.0.9fc3b06a46c45e7f3c554aeac9af24d878679877.001.1',
    'identifier': 'urn:oid:2.49.0.1.840.0.9fc3b06a46c45e7f3c554aeac9af24d878679877.001.1',
    'sender': 'w-nws.webmaster@noaa.gov',
    'sent': '2025-03-20T19:55:00-05:00'}],
  'sent': '2025-03-21T09:45:00-05:00',
  'effective': '2025-03-21T09:45:00-05:00',
  'onset': '2025-03-21T09:45:00-05:00',
  'expires': '2025-03-22T09:45:00-05:00',
  'ends': '2025-03-22T12:08:00-05:00',
  'status': 'Actual',
  'messageType': 'Update',
  'category': 'Met',
  'severity': 'Severe',
  'certainty': 'Observed',
  'urgency': 'Immediate',
  'event': 'Flood Warning',
  'sender': 'w-nws.webmaster@noaa.gov',
  'senderName': 'NWS Mobile AL',
  'headline': 'Flood Warning issued March 21 at 9:45AM CDT until March 22 at 12:08PM CDT by NWS Mobile AL',
  'description': '...The Flood Warning continues for the following rivers in Alabama...\n\nTombigbee River Near Coffeeville Dam affecting Choctaw, Clarke\nand Washington Counties.\n\nFor the Tombigbee River...including Coffeeville Dam - Pool,\nCoffeeville Dam, Leroy...Minor flooding is forecast.\n\n* WHAT...Minor flooding is occurring.\n\n* WHERE...Tombigbee River near Coffeeville Dam.\n\n* WHEN...Until early tomorrow afternoon.\n\n* IMPACTS...At 29.0 feet, pastureland becomes flooded. Livestock\nshould be moved to higher ground. Old Ferry Road near the river\nbegins to flood.\n\n* ADDITIONAL DETAILS...\n- At 9:30 AM CDT Friday the stage was 30.5 feet.\n- Forecast...The river is expected to fall below flood stage\ntomorrow morning and continue falling to 13.7 feet Wednesday\nmorning.\n- Flood stage is 29.0 feet.\n- http://www.weather.gov/safety/flood',
  'instruction': "Turn around, don't drown when encountering flooded roads. Most flood\ndeaths occur in vehicles.\n\nAdditional information is available at www.weather.gov/mob.\n\nThe next statement will be issued when updates occur.",
  'response': 'Avoid',
  'parameters': {'AWIPSidentifier': ['FLSMOB'],
   'WMOidentifier': ['WGUS84 KMOB 211445'],
   'NWSheadline': ['FLOOD WARNING NOW IN EFFECT UNTIL EARLY TOMORROW AFTERNOON'],
   'BLOCKCHANNEL': ['EAS', 'NWEM', 'CMAS'],
   'EAS-ORG': ['WXR'],
   'VTEC': ['/O.EXT.KMOB.FL.W.0008.000000T0000Z-250322T1708Z/'],
   'eventEndingTime': ['2025-03-22T17:08:00+00:00'],
   'expiredReferences': ['w-nws.webmaster@noaa.gov,urn:oid:2.49.0.1.840.0.eaa1fbd6d1f7a24e80c19195beac80f006cb0e5e.001.1,2025-03-20T09:02:00-05:00 w-nws.webmaster@noaa.gov,urn:oid:2.49.0.1.840.0.f4b2046dc40dfd103e4b9487e462a2e864b20960.001.1,2025-03-19T20:43:00-05:00 w-nws.webmaster@noaa.gov,urn:oid:2.49.0.1.840.0.fe1011f7fbb0eb9ac53ccfbc03548dd517db62fe.001.1,2025-03-19T09:27:00-05:00 w-nws.webmaster@noaa.gov,urn:oid:2.49.0.1.840.0.c3912a0e2302b9f31ee0da7613296d2c82f00f00.001.1,2025-03-18T20:21:00-05:00 w-nws.webmaster@noaa.gov,urn:oid:2.49.0.1.840.0.8856bce35e98896bff960a8b1c55d2ca58f590e6.001.1,2025-03-18T10:23:00-05:00 w-nws.webmaster@noaa.gov,urn:oid:2.49.0.1.840.0.1b57560647f1ebc8812fd12763121773f5a185b4.001.1,2025-03-17T10:38:00-05:00 w-nws.webmaster@noaa.gov,urn:oid:2.49.0.1.840.0.0567914bf5ce26a10d61e981da956ca3528a9cd8.001.1,2025-03-17T00:47:00-05:00 w-nws.webmaster@noaa.gov,urn:oid:2.49.0.1.840.0.7b3cb47026c77c77ab451b7af5a1b504ac9a21bc.001.1,2025-03-16T13:56:00-05:00 w-nws.webmaster@noaa.gov,urn:oid:2.49.0.1.840.0.6073d3a1fa73db3cb5a578f1ff1c85ce6aa76c7b.001.1,2025-03-15T21:09:00-05:00']}}}
for event in response['features']:
    print(event['properties']['headline'])
Flood Warning issued March 21 at 9:45AM CDT until March 22 at 12:08PM CDT by NWS Mobile AL
Flood Warning issued March 21 at 9:44AM CDT until March 22 at 11:00PM CDT by NWS Mobile AL
Output data is for a specific location and is not current; visit the National Weather Service website for up-to-date information.