U.S. Bureau of Economic Analysis (BEA) API in Python#
by Michael T. Moen
The U.S. Bureau of Economic Analysis (BEA) API provides programmatic access to economic data published by the BEA.
This product uses the Bureau of Economic Analysis (BEA) Data API but is not endorsed or certified by BEA.
Please see the following resources for more information on API usage:
Documentation
Terms of Use
NOTE: The BEA API limits requests to a maximum of 100 requests/minute, 100 MB/minute, and 30 errors/minute.
These recipe examples were tested on March 7, 2025.
Setup#
Import Libraries#
The following external libraries need to be installed into your environment to run the code examples in this tutorial:
We import the libraries used in this tutorial below:
import os
import requests
import matplotlib.pyplot as plt
from dotenv import load_dotenv
Import UserID#
An UserID is required to access the BEA API. You can sign up for one here.
We keep our API key in a .env file and use the dotenv library to access it. If you would like to use this method, create a file named .env in the same directory as this notebook and add the following line to it:
BEA_API_USERID="add-userid-here"
load_dotenv()
try:
    USERID = os.environ["BEA_API_USERID"]
except KeyError:
    print("API key not found. Please set 'BEA_API_USERID' in your .env file.")
1. Finding Value Added by Industry in 2022#
Note: This section uses the GDP by Industry dataset, which can be explored here.
To get started, let’s use the GetDatasetList method to get a list of all tables in the BEA database. In this example, we are interested in the GDPbyIndustry table.
Note that the ResultFormat is set to JSON in this URL, indicating that the API response will be in JSON. By default, the BEA API will return data in JSON, but it can also be set to XML if that is the format you would like to receive the response in. Later examples in this tutorial will not specify a ResultFormat. Additionally, the UserID parameter is set to the value specified in the Setup part of this tutorial.
BASE_URL = 'https://apps.bea.gov/api/data'
params = {
    'method': 'GetDatasetList',
    'ResultFormat': 'JSON',
    'UserID': USERID
}
data = requests.get(BASE_URL, params=params).json()

# Print tables with descriptions
for dataset in data['BEAAPI']['Results']['Dataset']:
    print(f'{dataset['DatasetName']:<25}: {dataset['DatasetDescription']}')
NIPA                     : Standard NIPA tables
NIUnderlyingDetail       : Standard NI underlying detail tables
MNE                      : Multinational Enterprises
FixedAssets              : Standard Fixed Assets tables
ITA                      : International Transactions Accounts
IIP                      : International Investment Position
InputOutput              : Input-Output Data
IntlServTrade            : International Services Trade
IntlServSTA              : International Services Supplied Through Affiliates
GDPbyIndustry            : GDP by Industry
Regional                 : Regional data sets
UnderlyingGDPbyIndustry  : Underlying GDP by Industry
APIDatasetMetaData       : Metadata about other API datasets
Get Parameter Values#
In order to query the data of the database, we must first determine the parameters necessary to make a request. To do this, we must use the GetParameterList method, which provides parameter names, descriptions, and information about the values accepted for the parameter, including whether it is required for a request.
params = {
    'method': 'GetParameterList',
    'datasetname': 'GDPbyIndustry',
    'UserID': USERID
}
data = requests.get(BASE_URL, params=params).json()

# Display response
data['BEAAPI']['Results']['Parameter']
[{'ParameterName': 'Frequency',
  'ParameterDataType': 'string',
  'ParameterDescription': 'A - Annual, Q-Quarterly',
  'ParameterIsRequiredFlag': '1',
  'ParameterDefaultValue': '',
  'MultipleAcceptedFlag': '1',
  'AllValue': 'ALL'},
 {'ParameterName': 'Industry',
  'ParameterDataType': 'string',
  'ParameterDescription': 'List of industries to retrieve (ALL for All)',
  'ParameterIsRequiredFlag': '1',
  'ParameterDefaultValue': '',
  'MultipleAcceptedFlag': '1',
  'AllValue': 'ALL'},
 {'ParameterName': 'TableID',
  'ParameterDataType': 'integer',
  'ParameterDescription': 'The unique GDP by Industry table identifier (ALL for All)',
  'ParameterIsRequiredFlag': '1',
  'ParameterDefaultValue': '',
  'MultipleAcceptedFlag': '1',
  'AllValue': 'ALL'},
 {'ParameterName': 'Year',
  'ParameterDataType': 'integer',
  'ParameterDescription': 'List of year(s) of data to retrieve (ALL for All)',
  'ParameterIsRequiredFlag': '1',
  'ParameterDefaultValue': '',
  'MultipleAcceptedFlag': '1',
  'AllValue': 'ALL'}]
The result above indicates that there are 4 parameters required to query the GDPbyIndustry dataset: Frequency, Industry, TableID, and Year.
To find what values these parameters can take, we must use the GetParameterValues method. Using this method for the Frequency parameter returns a list of keys for each industry as well as the frequency at with which each is available (A for annually and Q for quarterly).
params = {
    'method': 'GetParameterValues',
    'datasetname': 'GDPbyIndustry',
    'ParameterName': 'Industry',
    'UserID': USERID
}
data = requests.get(BASE_URL, params=params).json()

# Print industry keys and descriptions
for parameter in data['BEAAPI']['Results']['ParamValue']:
    print(f'{parameter['Key']:<6}: {parameter['Desc']}')
11    : Agriculture, forestry, fishing, and hunting (A,Q)
111CA : Farms (A,Q)
113FF : Forestry, fishing, and related activities (A,Q)
21    : Mining (A,Q)
211   : Oil and gas extraction (A,Q)
212   : Mining, except oil and gas (A,Q)
213   : Support activities for mining (A,Q)
22    : Utilities (A,Q)
23    : Construction (A,Q)
311FT : Food and beverage and tobacco products (A,Q)
313TT : Textile mills and textile product mills (A,Q)
315AL : Apparel and leather and allied products (A,Q)
31G   : Manufacturing (A,Q)
31ND  : Nondurable goods (A,Q)
321   : Wood products (A,Q)
322   : Paper products (A,Q)
323   : Printing and related support activities (A,Q)
324   : Petroleum and coal products (A,Q)
325   : Chemical products (A,Q)
326   : Plastics and rubber products (A,Q)
327   : Nonmetallic mineral products (A,Q)
331   : Primary metals (A,Q)
332   : Fabricated metal products (A,Q)
333   : Machinery (A,Q)
334   : Computer and electronic products (A,Q)
335   : Electrical equipment, appliances, and components (A,Q)
3361MV: Motor vehicles, bodies and trailers, and parts (A,Q)
3364OT: Other transportation equipment (A,Q)
337   : Furniture and related products (A,Q)
339   : Miscellaneous manufacturing (A,Q)
33DG  : Durable goods (A,Q)
42    : Wholesale trade (A,Q)
441   : Motor vehicle and parts dealers (A,Q)
445   : Food and beverage stores (A,Q)
44RT  : Retail trade (A,Q)
452   : General merchandise stores (A,Q)
481   : Air transportation (A,Q)
482   : Rail transportation (A,Q)
483   : Water transportation (A,Q)
484   : Truck transportation (A,Q)
485   : Transit and ground passenger transportation (A,Q)
486   : Pipeline transportation (A,Q)
487OS : Other transportation and support activities (A,Q)
48TW  : Transportation and warehousing (A,Q)
493   : Warehousing and storage (A,Q)
4A0   : Other retail (A,Q)
51    : Information (A,Q)
511   : Publishing industries, except internet (includes software) (A,Q)
512   : Motion picture and sound recording industries (A,Q)
513   : Broadcasting and telecommunications (A,Q)
514   : Data processing, internet publishing, and other information services (A,Q)
52    : Finance and insurance (A,Q)
521CI : Federal Reserve banks, credit intermediation, and related activities (A,Q)
523   : Securities, commodity contracts, and investments (A,Q)
524   : Insurance carriers and related activities (A,Q)
525   : Funds, trusts, and other financial vehicles (A,Q)
53    : Real estate and rental and leasing (A,Q)
531   : Real estate (A,Q)
532RL : Rental and leasing services and lessors of intangible assets (A,Q)
54    : Professional, scientific, and technical services (A,Q)
5411  : Legal services (A,Q)
5412OP: Miscellaneous professional, scientific, and technical services (A,Q)
5415  : Computer systems design and related services (A,Q)
55    : Management of companies and enterprises (A,Q)
56    : Administrative and waste management services (A,Q)
561   : Administrative and support services (A,Q)
562   : Waste management and remediation services (A,Q)
6     : Educational services, health care, and social assistance (A,Q)
61    : Educational services (A,Q)
62    : Health care and social assistance (A,Q)
621   : Ambulatory health care services (A,Q)
622   : Hospitals (A,Q)
622HO : Hospitals and nursing and residential care facilities (A,Q)
623   : Nursing and residential care facilities (A,Q)
624   : Social assistance (A,Q)
7     : Arts, entertainment, recreation, accommodation, and food services (A,Q)
71    : Arts, entertainment, and recreation (A,Q)
711AS : Performing arts, spectator sports, museums, and related activities (A,Q)
713   : Amusements, gambling, and recreation industries (A,Q)
72    : Accommodation and food services (A,Q)
721   : Accommodation (A,Q)
722   : Food services and drinking places (A,Q)
81    : Other services, except government (A,Q)
FIRE  : Finance, insurance, real estate, rental, and leasing (A,Q)
G     : Government (A,Q)
GDP   : Gross domestic product (A,Q)
GF    : Federal (A,Q)
GFE   : Government enterprises (A,Q)
GFG   : General government (A,Q)
GFGD  : National defense (A,Q)
GFGN  : Nondefense (A,Q)
GSL   : State and local (A,Q)
GSLE  : Government enterprises (A,Q)
GSLG  : General government (A,Q)
HS    : Housing (A,Q)
ICT   : Information-communications-technology-producing industries (A)
ICT   : Information-communications-technology-producing industries<sup> 4</sup> (A)
II    : All industries (A,Q)
NABI  : Not allocated by industry (A,Q)
ORE   : Other real estate (A,Q)
PGOOD : Private goods-producing industries (A,Q)
PROF  : Professional and business services (A,Q)
PSERV : Private services-producing industries (A,Q)
PVT   : Private industries (A,Q)
Next, we use the same method to get the table IDs of the dataset:
params = {
    'method': 'GetParameterValues',
    'datasetname': 'GDPbyIndustry',
    'ParameterName': 'tableid',
    'UserID': USERID
}
data = requests.get(BASE_URL, params=params).json()

# Print TableIDs and descriptions
for parameter in data['BEAAPI']['Results']['ParamValue']:
    print(f'{parameter['Key']:<6}: {parameter['Desc']}')
1     : Value Added by Industry (A) (Q)
5     : Value added by Industry as a Percentage of Gross Domestic Product (A) (Q)
6     : Components of Value Added by Industry (A)
7     : Components of Value Added by Industry as a Percentage of Value Added (A)
8     : Chain-Type Quantity Indexes for Value Added by Industry (A) (Q)
9     : Percent Changes in Chain-Type Quantity Indexes for Value Added by Industry (A) (Q)
10    : Real Value Added by Industry (A) (Q)
11    : Chain-Type Price Indexes for Value Added by Industry (A) (Q)
12    : Percent Changes in Chain-Type Price Indexes for Value Added by Industry (A) (Q)
13    : Contributions to Percent Change in Real Gross Domestic Product by Industry (A) (Q)
14    : Contributions to Percent Change in the Chain-Type Price Index for Gross Domestic Product by Industry (A) (Q)
15    : Gross Output by Industry (A) (Q)
16    : Chain-Type Quantity Indexes for Gross Output by Industry (A) (Q)
17    : Percent Changes in Chain-Type Quantity Indexes for Gross Output by Industry (A) (Q)
18    : Chain-Type Price Indexes for Gross Output by Industry (A) (Q)
19    : Percent Changes in Chain-Type Price Indexes for Gross Output by Industry (A) (Q)
20    : Intermediate Inputs by Industry (A) (Q)
21    : Chain-Type Quantity Indexes for Intermediate Inputs by Industry (A) (Q)
22    : Percent Changes in Chain-Type Quantity Indexes for Intermediate Inputs by Industry (A) (Q)
23    : Chain-Type Price Indexes for Intermediate Inputs by Industry (A) (Q)
24    : Percent Changes in Chain-Type Price Indexes for Intermediate Inputs by Industry (A) (Q)
25    : Composition of Gross Output by Industry (A)
26    : Shares of Gross Output by Industry (A)
29    : Contributions to Percent Changes in Chain-Type Quantity Indexes for Gross Output by Industry Group (A)
30    : Contributions to Percent Changes in Chain-Type Price Indexes for Gross Output by Industry Group (A)
31    : Chain-Type Quantity Indexes for Energy Inputs by Industry (A)
32    : Contributions to Percent Change by Industry in the Chain-Type Quantity Index for All Industries Energy Inputs (A)
33    : Chain-Type Price Indexes for Energy Inputs by Industry (A)
34    : Contributions to Percent Change by Industry in the Chain-Type Price Index for All Industries Energy Inputs (A)
35    : Chain-Type Quantity Indexes for Materials Inputs by Industry (A)
36    : Contributions to Percent Change by Industry in the Chain-Type Quantity Index for All Industries Materials Inputs (A)
37    : Chain-Type Price Indexes for Materials Inputs by Industry (A)
38    : Contributions to Percent Change by Industry in the Chain-Type Price Index for All Industries Materials Inputs (A)
39    : Chain-Type Quantity Indexes for Purchased Service Inputs by Industry (A)
40    : Contributions to Percent Change by Industry in the Chain-Type Quantity Index for All Industries Purchased Service Inputs (A)
41    : Chain-Type Price Indexes for Purchased Service Inputs by Industry (A)
42    : Contributions to Percent Change by Industry in the Chain-Type Price Index for All Industries Purchased Service Inputs (A)
208   : Real Gross Output by Industry (A) (Q)
209   : Real Intermediate Inputs by Industry (A) (Q)
Finally, we look at the years available in the dataset:
params = {
    'method': 'GetParameterValues',
    'datasetname': 'GDPbyIndustry',
    'ParameterName': 'year',
    'UserID': USERID
}
data = requests.get(BASE_URL, params=params).json()

# Print years
for parameter in data['BEAAPI']['Results']['ParamValue']:
    print(parameter['Key'], end=", ")
1997, 1998, 1999, 2000, 2001, 2002, 2003, 2004, 2005, 2006, 2007, 2008, 2009, 2010, 2011, 2012, 2013, 2014, 2015, 2016, 2017, 2018, 2019, 2020, 2021, 2022, 2023,
Get Data#
Now that we have determined the parameters needed to retrieve the data we are looking for, we can use the GetData method to retrieve this data.
In this example, we use the all value for the industry parameter to obtain the data for all industries. Note that usage of this value should be limited in order to adhere to the API’s rate limits.
params = {
    'method': 'GetData',
    'datasetname': 'GDPbyIndustry',
    'Industry': 'all',  # Data for all industries
    'Frequency': 'A',   # Annual data
    'tableid': 1,       # Value Added by Industry
    'year': 2022,       # Data for 2022
    'UserID': USERID
}
data = requests.get(BASE_URL, params=params).json()

# Display number of results
len(data['BEAAPI']['Results'][0]['Data'])
100
# Print results in a table
print(f'{'Industry':<75} Value Added (in million USD)')
for industry in data['BEAAPI']['Results'][0]['Data']:
    print(f'{industry['IndustrYDescription']:<75} {industry['DataValue']}')
Industry                                                                    Value Added (in million USD)
Agriculture, forestry, fishing, and hunting                                 290.0
Farms                                                                       241.9
Forestry, fishing, and related activities                                   48.1
Mining                                                                      460.6
Oil and gas extraction                                                      319.1
Mining, except oil and gas                                                  78.4
Support activities for mining                                               63.1
Utilities                                                                   443.6
Construction                                                                1114.3
Food and beverage and tobacco products                                      296.8
Textile mills and textile product mills                                     17.4
Apparel and leather and allied products                                     12.3
Manufacturing                                                               2684.5
Nondurable goods                                                            1284.8
Wood products                                                               64.1
Paper products                                                              70.3
Printing and related support activities                                     41.6
Petroleum and coal products                                                 230.3
Chemical products                                                           521.5
Plastics and rubber products                                                94.7
Nonmetallic mineral products                                                72.0
Primary metals                                                              84.8
Fabricated metal products                                                   175.5
Machinery                                                                   175.6
Computer and electronic products                                            298.9
Electrical equipment, appliances, and components                            69.9
Motor vehicles, bodies and trailers, and parts                              160.2
Other transportation equipment                                              160.4
Furniture and related products                                              32.3
Miscellaneous manufacturing                                                 106.1
Durable goods                                                               1399.7
Wholesale trade                                                             1595.5
Motor vehicle and parts dealers                                             340.4
Food and beverage stores                                                    209.9
Retail trade                                                                1628.9
General merchandise stores                                                  195.0
Air transportation                                                          146.7
Rail transportation                                                         52.0
Water transportation                                                        22.6
Truck transportation                                                        259.2
Transit and ground passenger transportation                                 57.0
Pipeline transportation                                                     45.0
Other transportation and support activities                                 218.3
Transportation and warehousing                                              916.3
Warehousing and storage                                                     115.5
Other retail                                                                883.6
Information                                                                 1367.5
Publishing industries, except internet (includes software)                  357.6
Motion picture and sound recording industries                               113.6
Broadcasting and telecommunications                                         484.2
Data processing, internet publishing, and other information services        412.1
Finance and insurance                                                       1935.6
Federal Reserve banks, credit intermediation, and related activities        878.5
Securities, commodity contracts, and investments                            350.5
Insurance carriers and related activities                                   686.8
Funds, trusts, and other financial vehicles                                 19.8
Real estate and rental and leasing                                          3481.9
Real estate                                                                 3167.0
Rental and leasing services and lessors of intangible assets                314.9
Professional, scientific, and technical services                            2060.7
Legal services                                                              348.8
Miscellaneous professional, scientific, and technical services              1248.0
Computer systems design and related services                                463.9
Management of companies and enterprises                                     482.6
Administrative and waste management services                                837.7
Administrative and support services                                         763.7
Waste management and remediation services                                   74.0
Educational services, health care, and social assistance                    2151.4
Educational services                                                        292.0
Health care and social assistance                                           1859.4
Ambulatory health care services                                             906.2
Hospitals                                                                   595.1
Nursing and residential care facilities                                     179.8
Social assistance                                                           178.3
Arts, entertainment, recreation, accommodation, and food services           1067.9
Arts, entertainment, and recreation                                         264.2
Performing arts, spectator sports, museums, and related activities          149.3
Amusements, gambling, and recreation industries                             114.9
Accommodation and food services                                             803.7
Accommodation                                                               217.9
Food services and drinking places                                           585.8
Other services, except government                                           549.3
Finance, insurance, real estate, rental, and leasing                        5417.5
Government                                                                  2938.6
Gross domestic product                                                      26006.9
Federal                                                                     944.9
Government enterprises                                                      73.5
General government                                                          871.4
National defense                                                            497.5
Nondefense                                                                  373.9
State and local                                                             1993.7
Government enterprises                                                      152.4
General government                                                          1841.3
Housing                                                                     2414.2
Information-communications-technology-producing industries<sup>3</sup>      1812.2
Other real estate                                                           752.8
Private goods-producing industries<sup>1</sup>                              4549.4
Professional and business services                                          3381.0
Private services-producing industries<sup>2</sup>                           18519.0
Private industries                                                          23068.3
2. Finding Wages by Year through NIPA Tables#
Note: This section uses the National Income and Product Accounts (NIPA) dataset, which can be explored here.
In this section, we query the NIPA dataset. In order to find what parameters are necessary to query this dataset, we must first use the GetParameterList:
params = {
    'method': 'GetParameterList',
    'datasetname': 'NIPA',
    'UserID': USERID
}
data = requests.get(BASE_URL, params=params).json()

# Display response
data['BEAAPI']['Results']['Parameter']
[{'ParameterName': 'Frequency',
  'ParameterDataType': 'string',
  'ParameterDescription': 'A - Annual, Q-Quarterly, M-Monthly',
  'ParameterIsRequiredFlag': '1',
  'ParameterDefaultValue': '',
  'MultipleAcceptedFlag': '1',
  'AllValue': ''},
 {'ParameterName': 'ShowMillions',
  'ParameterDataType': 'string',
  'ParameterDescription': 'A flag indicating that million-dollar data should be returned.',
  'ParameterIsRequiredFlag': '0',
  'ParameterDefaultValue': 'N',
  'MultipleAcceptedFlag': '0',
  'AllValue': ''},
 {'ParameterName': 'TableID',
  'ParameterDataType': 'integer',
  'ParameterDescription': 'The standard NIPA table identifier',
  'ParameterIsRequiredFlag': '0',
  'MultipleAcceptedFlag': '0',
  'AllValue': ''},
 {'ParameterName': 'TableName',
  'ParameterDataType': 'string',
  'ParameterDescription': 'The new NIPA table identifier',
  'ParameterIsRequiredFlag': '0',
  'MultipleAcceptedFlag': '0',
  'AllValue': ''},
 {'ParameterName': 'Year',
  'ParameterDataType': 'integer',
  'ParameterDescription': 'List of year(s) of data to retrieve (X for All)',
  'ParameterIsRequiredFlag': '1',
  'ParameterDefaultValue': '',
  'MultipleAcceptedFlag': '1',
  'AllValue': 'X'}]
Now, we use the GetParameterValues function to find what parameter values we can use in our API request. The example below finds the values for the year and TableID parameters:
method = 'GetParameterValues'
dataset = 'NIPA'

# Find years available for each table
params = {
    'method': method,
    'datasetname': dataset,
    'ParameterName': 'year',
    'UserID': USERID
}
year_data = requests.get(BASE_URL, params=params).json()

a_years = {}       # Years that have annual data available
q_years = {}    # Years that have quarterly data available
for table in year_data['BEAAPI']['Results']['ParamValue']:
    a_years[table['TableName']] = (table['FirstAnnualYear'], table['LastAnnualYear'])
    q_years[table['TableName']] = (table['FirstQuarterlyYear'], table['LastQuarterlyYear'])

# Find table IDs
params = {
    'method': method,
    'datasetname': dataset,
    'ParameterName': 'TableID',
    'UserID': USERID
}
table_id_data = requests.get(BASE_URL, params=params).json()

# Display table names, descriptions, and years available
print(f'{'Table':<8}| {'Annually':<9} | {'Quarterly':<9} | Description')
for id in table_id_data['BEAAPI']['Results']['ParamValue']:
    name = id['TableName']
    print(f'{name:<8}| {a_years[name][0]:>4}-{a_years[name][1]:>4} | '
          f'{q_years[name][0]:>4}-{q_years[name][1]:>4} | {id['Description']}')
Table   | Annually  | Quarterly | Description
T10101  | 1930-2024 | 1947-2024 | Table 1.1.1. Percent Change From Preceding Period in Real Gross Domestic Product (A) (Q)
T10102  | 1930-2024 | 1947-2024 | Table 1.1.2. Contributions to Percent Change in Real Gross Domestic Product (A) (Q)
T10103  | 1929-2024 | 1947-2024 | Table 1.1.3. Real Gross Domestic Product, Quantity Indexes (A) (Q)
T10104  | 1929-2024 | 1947-2024 | Table 1.1.4. Price Indexes for Gross Domestic Product (A) (Q)
T10105  | 1929-2024 | 1947-2024 | Table 1.1.5. Gross Domestic Product (A) (Q)
T10106  | 1929-2024 | 1947-2024 | Table 1.1.6. Real Gross Domestic Product, Chained Dollars (A) (Q)
T10107  | 1930-2024 | 1947-2024 | Table 1.1.7. Percent Change From Preceding Period in Prices for Gross Domestic Product (A) (Q)
T10108  | 1930-2024 | 1947-2024 | Table 1.1.8. Contributions to Percent Change in the Gross Domestic Product Price Index (A) (Q)
T10109  | 1929-2024 | 1947-2024 | Table 1.1.9. Implicit Price Deflators for Gross Domestic Product (A) (Q)
T10110  | 1929-2024 | 1947-2024 | Table 1.1.10. Percentage Shares of Gross Domestic Product (A) (Q)
T10111  |    0-   0 | 1948-2024 | Table 1.1.11. Real Gross Domestic Product: Percent Change From Quarter One Year Ago (Q)
T10201  | 1930-2024 | 1947-2024 | Table 1.2.1. Percent Change From Preceding Period in Real Gross Domestic Product by Major Type of Product (A) (Q)
T10202  | 1930-2024 | 1947-2024 | Table 1.2.2. Contributions to Percent Change in Real Gross Domestic Product by Major Type of Product (A) (Q)
T10203  | 1929-2024 | 1947-2024 | Table 1.2.3. Real Gross Domestic Product by Major Type of Product, Quantity Indexes (A) (Q)
T10204  | 1929-2024 | 1947-2024 | Table 1.2.4. Price Indexes for Gross Domestic Product by Major Type of Product (A) (Q)
T10205  | 1929-2024 | 1947-2024 | Table 1.2.5. Gross Domestic Product by Major Type of Product (A) (Q)
T10206  | 1929-2024 | 1947-2024 | Table 1.2.6. Real Gross Domestic Product by Major Type of Product, Chained Dollars (A) (Q)
T10301  | 1930-2024 | 1947-2024 | Table 1.3.1. Percent Change From Preceding Period in Real Gross Value Added by Sector (A) (Q)
T10303  | 1929-2024 | 1947-2024 | Table 1.3.3. Real Gross Value Added by Sector, Quantity Indexes (A) (Q)
T10304  | 1929-2024 | 1947-2024 | Table 1.3.4. Price Indexes for Gross Value Added by Sector (A) (Q)
T10305  | 1929-2024 | 1947-2024 | Table 1.3.5. Gross Value Added by Sector (A) (Q)
T10306  | 1929-2024 | 1947-2024 | Table 1.3.6. Real Gross Value Added by Sector, Chained Dollars (A) (Q)
T10401  | 1930-2024 | 1947-2024 | Table 1.4.1. Percent Change From Preceding Period in Real Gross Domestic Product, Real Gross Domestic Purchases, and Real Final Sales to Domestic Purchasers (A) (Q)
T10403  | 1929-2024 | 1947-2024 | Table 1.4.3. Real Gross Domestic Product, Real Gross Domestic Purchases, and Real Final Sales to Domestic Purchasers, Quantity Indexes (A) (Q)
T10404  | 1929-2024 | 1947-2024 | Table 1.4.4. Price Indexes for Gross Domestic Product, Gross Domestic Purchases, and Final Sales to Domestic Purchasers (A) (Q)
T10405  | 1929-2024 | 1947-2024 | Table 1.4.5. Relation of Gross Domestic Product, Gross Domestic Purchases, and Final Sales to Domestic Purchasers (A) (Q)
T10406  | 1929-2024 | 1947-2024 | Table 1.4.6. Relation of Real Gross Domestic Product, Real Gross Domestic Purchases, and Real Final Sales to Domestic Purchasers, Chained Dollars (A) (Q)
T10501  | 1930-2024 | 1947-2024 | Table 1.5.1. Percent Change From Preceding Period in Real Gross Domestic Product, Expanded Detail (A) (Q)
T10502  | 1930-2024 | 1947-2024 | Table 1.5.2. Contributions to Percent Change in Real Gross Domestic Product, Expanded Detail (A) (Q)
T10503  | 1929-2024 | 1947-2024 | Table 1.5.3. Real Gross Domestic Product, Expanded Detail, Quantity Indexes (A) (Q)
T10504  | 1929-2024 | 1947-2024 | Table 1.5.4. Price Indexes for Gross Domestic Product, Expanded Detail (A) (Q)
T10505  | 1929-2024 | 1947-2024 | Table 1.5.5. Gross Domestic Product, Expanded Detail (A) (Q)
T10506  | 2007-2024 | 2007-2024 | Table 1.5.6. Real Gross Domestic Product, Expanded Detail, Chained Dollars (A) (Q)
T10604  | 1929-2024 | 1947-2024 | Table 1.6.4. Price Indexes for Gross Domestic Purchases (A) (Q)
T10607  | 1930-2024 | 1947-2024 | Table 1.6.7. Percent Change From Preceding Period in Prices for Gross Domestic Purchases (A) (Q)
T10608  | 1930-2024 | 1947-2024 | Table 1.6.8. Contributions to Percent Change in the Gross Domestic Purchases Price Index (A) (Q)
T10701  | 1930-2024 | 1947-2024 | Table 1.7.1. Percent Change From Preceding Period in Real Gross Domestic Product, Real Gross National Product, and Real Net National Product (A) (Q)
T10703  | 1929-2024 | 1947-2024 | Table 1.7.3. Real Gross Domestic Product, Real Gross National Product, and Real Net National Product, Quantity Indexes (A) (Q)
T10704  | 1929-2024 | 1947-2024 | Table 1.7.4. Price Indexes for Gross Domestic Product, Gross National Product, and Net National Product (A) (Q)
T10705  | 1929-2024 | 1947-2024 | Table 1.7.5. Relation of Gross Domestic Product, Gross National Product, Net National Product, National Income, and Personal Income (A) (Q)
T10706  | 1929-2024 | 1947-2024 | Table 1.7.6. Relation of Real Gross Domestic Product, Real Gross National Product, and Real Net National Product, Chained Dollars (A) (Q)
T10803  | 1929-2024 | 1947-2024 | Table 1.8.3. Command-Basis Real Gross Domestic Product and Gross National Product, Quantity Indexes (A) (Q)
T10806  | 1929-2024 | 1947-2024 | Table 1.8.6. Command-Basis Real Gross Domestic Product and Gross National Product, Chained Dollars (A) (Q)
T10903  | 1929-2023 |    0-   0 | Table 1.9.3. Real Net Value Added by Sector, Quantity Indexes (A)
T10904  | 1929-2023 |    0-   0 | Table 1.9.4. Price Indexes for Net Value Added by Sector (A)
T10905  | 1929-2023 |    0-   0 | Table 1.9.5. Net Value Added by Sector (A)
T10906  | 2007-2023 |    0-   0 | Table 1.9.6. Real Net Value Added by Sector, Chained Dollars (A)
T11000  | 1929-2024 | 1947-2024 | Table 1.10. Gross Domestic Income by Type of Income (A) (Q)
T11100  | 1929-2023 |    0-   0 | Table 1.11. Percentage Shares of Gross Domestic Income (A)
T11200  | 1929-2024 | 1947-2024 | Table 1.12. National Income by Type of Income (A) (Q)
T11300  | 1948-2023 |    0-   0 | Table 1.13. National Income by Sector, Legal Form of Organization, and Type of Income (A)
T11400  | 1929-2024 | 1947-2024 | Table 1.14. Gross Value Added of Domestic Corporate Business in Current Dollars and Gross Value Added of Nonfinancial Domestic Corporate Business in Current and Chained Dollars (A) (Q)
T11500  | 1929-2024 | 1947-2024 | Table 1.15. Price, Costs, and Profit Per Unit of Real Gross Value Added of Nonfinancial Domestic Corporate Business (A) (Q)
T11600  | 1948-2023 |    0-   0 | Table 1.16. Sources and Uses of Private Enterprise Income (A)
T11701  | 1930-2024 | 1947-2024 | Table 1.17.1. Percent Change From Preceding Period in Real Gross Domestic Product, Real Gross Domestic Income, and Other Major NIPA Aggregates (A) (Q)
T11705  | 1929-2024 | 1947-2024 | Table 1.17.5. Gross Domestic Product, Gross Domestic Income, and Other Major NIPA Aggregates (A) (Q)
T11706  | 1929-2024 | 1947-2024 | Table 1.17.6. Real Gross Domestic Product, Real Gross Domestic Income, and Other Major NIPA Aggregates, Chained Dollars (A) (Q)
T20100  | 1929-2024 | 1947-2024 | Table 2.1. Personal Income and Its Disposition (A) (Q)
T20200A | 1929-2000 | 1947-2000 | Table 2.2A. Wages and Salaries by Industry (A) (Q)
T20200B | 1998-2024 | 2001-2024 | Table 2.2B. Wages and Salaries by Industry (A) (Q)
T20301  | 1930-2024 | 1947-2024 | Table 2.3.1. Percent Change From Preceding Period in Real Personal Consumption Expenditures by Major Type of Product (A) (Q)
T20302  | 1930-2024 | 1947-2024 | Table 2.3.2. Contributions to Percent Change in Real Personal Consumption Expenditures by Major Type of Product (A) (Q)
T20303  | 1929-2024 | 1947-2024 | Table 2.3.3. Real Personal Consumption Expenditures by Major Type of Product, Quantity Indexes (A) (Q)
T20304  | 1929-2024 | 1947-2024 | Table 2.3.4. Price Indexes for Personal Consumption Expenditures by Major Type of Product (A) (Q)
T20305  | 1929-2024 | 1947-2024 | Table 2.3.5. Personal Consumption Expenditures by Major Type of Product (A) (Q)
T20306  | 2007-2024 | 2007-2024 | Table 2.3.6. Real Personal Consumption Expenditures by Major Type of Product, Chained Dollars (A) (Q)
T20307  | 1930-2024 | 1947-2024 | Table 2.3.7. Percent Change From Preceding Period in Prices for Personal Consumption Expenditures by Major Type of Product (A) (Q)
T20308  | 1930-2024 | 1947-2024 | Table 2.3.8. Contributions to Percent Change in Prices for Personal Consumption Expenditures by Major Type of Product (A) (Q)
T20311  |    0-   0 | 1948-2024 | Table 2.3.11. Real Personal Consumption Expenditures by Major Type of Product: Percent Change from Quarter One Year Ago (Q)
T20401  | 1930-2024 | 1947-2024 | Table 2.4.1. Percent Change From Preceding Period in Real Personal Consumption Expenditures by Type of Product (A) (Q)
T20402  | 1930-2024 | 1947-2024 | Table 2.4.2. Contributions to Percent Change in Real Personal Consumption Expenditures by Type of Product (A) (Q)
T20403  | 1929-2024 | 1947-2024 | Table 2.4.3. Real Personal Consumption Expenditures by Type of Product, Quantity Indexes (A) (Q)
T20404  | 1929-2024 | 1947-2024 | Table 2.4.4. Price Indexes for Personal Consumption Expenditures by Type of Product (A) (Q)
T20405  | 1929-2024 | 1947-2024 | Table 2.4.5. Personal Consumption Expenditures by Type of Product (A) (Q)
T20406  | 2007-2024 | 2007-2024 | Table 2.4.6. Real Personal Consumption Expenditures by Type of Product, Chained Dollars (A) (Q)
T20407  | 1930-2024 | 1947-2024 | Table 2.4.7. Percent Change From Preceding Period in Prices for Personal Consumption Expenditures by Type of Product (A) (Q)
T20408  | 1930-2024 | 1947-2024 | Table 2.4.8. Contributions to Percent Change in Prices for Personal Consumption Expenditures by Type of Product (A) (Q)
T20503  | 1929-2023 |    0-   0 | Table 2.5.3. Real Personal Consumption Expenditures by Function, Quantity Indexes (A)
T20504  | 1929-2023 |    0-   0 | Table 2.5.4. Price Indexes for Personal Consumption Expenditures by Function (A)
T20505  | 1929-2023 |    0-   0 | Table 2.5.5. Personal Consumption Expenditures by Function (A)
T20506  | 2007-2023 |    0-   0 | Table 2.5.6. Real Personal Consumption Expenditures by Function, Chained Dollars (A)
T20600  |    0-   0 |    0-   0 | Table 2.6. Personal Income and Its Disposition, Monthly (M)
T20700A |    0-   0 |    0-   0 | Table 2.7A. Wages and Salaries by Industry, Monthly (M)
T20700B |    0-   0 |    0-   0 | Table 2.7B. Wages and Salaries by Industry, Monthly (M)
T20801  |    0-   0 |    0-   0 | Table 2.8.1. Percent Change From Preceding Period in Real Personal Consumption Expenditures by Major Type of Product, Monthly (M)
T20802  |    0-   0 |    0-   0 | Table 2.8.2. Contributions to Percent Change in Real Personal Consumption Expenditures by Major Type of Product, Monthly (M)
T20803  |    0-   0 |    0-   0 | Table 2.8.3. Real Personal Consumption Expenditures by Major Type of Product, Monthly, Quantity Indexes (M)
T20804  |    0-   0 |    0-   0 | Table 2.8.4. Price Indexes for Personal Consumption Expenditures by Major Type of Product, Monthly (M)
T20805  |    0-   0 |    0-   0 | Table 2.8.5. Personal Consumption Expenditures by Major Type of Product, Monthly (M)
T20806  |    0-   0 |    0-   0 | Table 2.8.6. Real Personal Consumption Expenditures by Major Type of Product, Monthly, Chained Dollars (M)
T20807  |    0-   0 |    0-   0 | Table 2.8.7. Percent Change From Preceding Period in Prices for Personal Consumption Expenditures by Major Type of Product, Monthly (M)
T20808  |    0-   0 |    0-   0 | Table 2.8.8. Contributions to Percent Change in Prices for Personal Consumption Expenditures by Major Type of Product, Monthly (M)
T20811  |    0-   0 |    0-   0 | Table 2.8.11. Real Personal Consumption Expenditures by Major Type of Product: Percent Change from Month One Year Ago (M)
T20900  | 1992-2023 |    0-   0 | Table 2.9. Personal Income and Its Disposition by Households and by Nonprofit Institutions Serving Households (A)
T21000  | 2000-2023 |    0-   0 | Table 2.10. Distributions of Personal and Disposable Income for Households (A)
T30100  | 1929-2024 | 1947-2024 | Table 3.1. Government Current Receipts and Expenditures (A) (Q)
T30200  | 1929-2024 | 1947-2024 | Table 3.2. Federal Government Current Receipts and Expenditures (A) (Q)
T30300  | 1929-2024 | 1947-2024 | Table 3.3. State and Local Government Current Receipts and Expenditures (A) (Q)
T30400  | 1929-2023 |    0-   0 | Table 3.4. Personal Current Tax Receipts (A)
T30500  | 1929-2023 |    0-   0 | Table 3.5. Taxes on Production and Imports (A)
T30600  | 1929-2023 |    0-   0 | Table 3.6. Contributions for Government Social Insurance (A)
T30700  | 1929-2023 |    0-   0 | Table 3.7. Government Current Transfer Receipts (A)
T30800  | 1960-2023 |    0-   0 | Table 3.8. Current Surplus of Government Enterprises (A)
T30901  | 1930-2024 | 1947-2024 | Table 3.9.1. Percent Change From Preceding Period in Real Government Consumption Expenditures and Gross Investment (A) (Q)
T30902  | 1930-2024 | 1947-2024 | Table 3.9.2. Contributions to Percent Change in Real Government Consumption Expenditures and Gross Investment (A) (Q)
T30903  | 1929-2024 | 1947-2024 | Table 3.9.3. Real Government Consumption Expenditures and Gross Investment, Quantity Indexes (A) (Q)
T30904  | 1929-2024 | 1947-2024 | Table 3.9.4. Price Indexes for Government Consumption Expenditures and Gross Investment (A) (Q)
T30905  | 1929-2024 | 1947-2024 | Table 3.9.5. Government Consumption Expenditures and Gross Investment (A) (Q)
T30906  | 2007-2024 | 2007-2024 | Table 3.9.6. Real Government Consumption Expenditures and Gross Investment, Chained Dollars (A) (Q)
T31001  | 1930-2024 | 1947-2024 | Table 3.10.1. Percent Change From Preceding Period in Real Government Consumption Expenditures and General Government Gross Output (A) (Q)
T31003  | 1929-2024 | 1947-2024 | Table 3.10.3. Real Government Consumption Expenditures and General Government Gross Output, Quantity Indexes (A) (Q)
T31004  | 1929-2024 | 1947-2024 | Table 3.10.4. Price Indexes for Government Consumption Expenditures and General Government Gross Output (A) (Q)
T31005  | 1929-2024 | 1947-2024 | Table 3.10.5. Government Consumption Expenditures and General Government Gross Output (A) (Q)
T31006  | 2007-2024 | 2007-2024 | Table 3.10.6. Real Government Consumption Expenditures and General Government Gross Output, Chained Dollars (A) (Q)
T31101  | 1973-2024 | 1972-2024 | Table 3.11.1. Percent Change From Preceding Period in Real National Defense Consumption Expenditures and Gross Investment by Type (A) (Q)
T31102  | 1973-2024 | 1972-2024 | Table 3.11.2. Contributions to Percent Change in National Defense Consumption Expenditures and Gross Investment by Type (A) (Q)
T31103  | 1972-2024 | 1972-2024 | Table 3.11.3. Real National Defense Consumption Expenditures and Gross Investment by Type, Quantity Indexes (A) (Q)
T31104  | 1972-2024 | 1972-2024 | Table 3.11.4. Price Indexes for National Defense Consumption Expenditures and Gross Investment by Type (A) (Q)
T31105  | 1972-2024 | 1972-2024 | Table 3.11.5. National Defense Consumption Expenditures and Gross Investment by Type (A) (Q)
T31106  | 2007-2024 | 2007-2024 | Table 3.11.6. Real National Defense Consumption Expenditures and Gross Investment by Type, Chained Dollars (A) (Q)
T31200  | 1929-2023 |    0-   0 | Table 3.12. Government Social Benefits (A)
T31300  | 1960-2023 |    0-   0 | Table 3.13. Subsidies (A)
T31400  | 1929-2023 |    0-   0 | Table 3.14. Government Social Insurance Funds Current Receipts and Expenditures (A)
T31501  | 1960-2023 |    0-   0 | Table 3.15.1. Percent Change From Preceding Period in Real Government Consumption Expenditures and Gross Investment by Function (A)
T31502  | 1960-2023 |    0-   0 | Table 3.15.2. Contributions to Percent Change in Real Government Consumption Expenditures and Gross Investment by Function (A)
T31503  | 1959-2023 |    0-   0 | Table 3.15.3. Real Government Consumption Expenditures and Gross Investment by Function, Quantity Indexes (A)
T31504  | 1959-2023 |    0-   0 | Table 3.15.4. Price Indexes for Government Consumption Expenditures and Gross Investment by Function (A)
T31505  | 1959-2023 |    0-   0 | Table 3.15.5. Government Consumption Expenditures and Gross Investment by Function (A)
T31506  | 2007-2023 |    0-   0 | Table 3.15.6. Real Government Consumption Expenditures and Gross Investment by Function, Chained Dollars (A)
T31600  | 1959-2023 |    0-   0 | Table 3.16. Government Current Expenditures by Function (A)
T31700  | 1959-2023 |    0-   0 | Table 3.17. Selected Government Current and Capital Expenditures by Function (A)
T31800A | 1952-1967 | 1959-1967 | Table 3.18A. Relation of Federal Government Current Receipts and Expenditures in the National Income and Product Accounts to the Consolidated Cash Statement, Fiscal Years and Quarters (A) (Q)
T31800B | 1968-2023 | 1968-2023 | Table 3.18B. Relation of Federal Government Current Receipts and Expenditures in the National Income and Product Accounts to the Budget, Fiscal Years and Quarters (A) (Q)
T31900  | 1959-2022 |    0-   0 | Table 3.19. Relation of State and Local Government Current Receipts and Expenditures in the National Income and Product Accounts to Census Bureau 'Government Finances' Data, Fiscal Years (A)
T32000  | 1959-2023 |    0-   0 | Table 3.20. State Government Current Receipts and Expenditures (A)
T32100  | 1959-2023 |    0-   0 | Table 3.21. Local Government Current Receipts and Expenditures (A)
T40100  | 1929-2024 | 1947-2024 | Table 4.1. Foreign Transactions in the National Income and Product Accounts (A) (Q)
T40201  | 1968-2024 | 1967-2024 | Table 4.2.1. Percent Change From Preceding Period in Real Exports and in Real Imports of Goods and Services by Type of Product (A) (Q)
T40202  | 1968-2024 | 1967-2024 | Table 4.2.2. Contributions to Percent Change in Real Exports and Real Imports of Goods and Services by Type of Product (A) (Q)
T40203A | 1967-1998 | 1967-1998 | Table 4.2.3A. Real Exports and Imports of Goods and Services by Type of Product, Quantity Indexes (A) (Q)
T40203B | 1999-2024 | 1999-2024 | Table 4.2.3B. Real Exports and Imports of Goods and Services by Type of Product, Quantity Indexes (A) (Q)
T40204A | 1967-1998 | 1967-1998 | Table 4.2.4A. Price Indexes for Exports and Imports of Goods and Services by Type of Product (A) (Q)
T40204B | 1999-2024 | 1999-2024 | Table 4.2.4B. Price Indexes for Exports and Imports of Goods and Services by Type of Product (A) (Q)
T40205A | 1967-1998 | 1967-1998 | Table 4.2.5A. Exports and Imports of Goods and Services by Type of Product (A) (Q)
T40205B | 1999-2024 | 1999-2024 | Table 4.2.5B. Exports and Imports of Goods and Services by Type of Product (A) (Q)
T40206B | 2007-2024 | 2007-2024 | Table 4.2.6B. Real Exports and Imports of Goods and Services by Type of Product, Chained Dollars (A) (Q)
T4030A  | 1946-1985 |    0-   0 | Table 4.3A. Relation of Foreign Transactions in the National Income and Product Accounts to the Corresponding Items in the International Transactions Accounts (A)
T4030B  | 1986-1998 |    0-   0 | Table 4.3B. Relation of Foreign Transactions in the National Income and Product Accounts to the Corresponding Items in the International Transactions Accounts (A)
T4030C  | 1999-2024 | 1999-2024 | Table 4.3C. Relation of Foreign Transactions in the National Income and Product Accounts to the Corresponding Items in the International Transactions Accounts (A) (Q)
T50100  | 1929-2024 | 1947-2024 | Table 5.1. Saving and Investment by Sector (A) (Q)
T50203  | 1929-2023 |    0-   0 | Table 5.2.3. Real Gross and Net Domestic Investment by Major Type, Quantity Indexes (A)
T50205  | 1929-2023 |    0-   0 | Table 5.2.5. Gross and Net Domestic Investment by Major Type (A)
T50206  | 1967-2023 |    0-   0 | Table 5.2.6. Real Gross and Net Domestic Investment by Major Type, Chained dollars (A)
T50301  | 1948-2024 | 1947-2024 | Table 5.3.1. Percent Change From Preceding Period in Real Private Fixed Investment by Type (A) (Q)
T50302  | 1948-2024 | 1947-2024 | Table 5.3.2. Contributions to Percent Change in Real Private Fixed Investment by Type (A) (Q)
T50303  | 1947-2024 | 1947-2024 | Table 5.3.3. Real Private Fixed Investment by Type, Quantity Indexes (A) (Q)
T50304  | 1947-2024 | 1947-2024 | Table 5.3.4. Price Indexes for Private Fixed Investment by Type (A) (Q)
T50305  | 1947-2024 | 1947-2024 | Table 5.3.5. Private Fixed Investment by Type (A) (Q)
T50306  | 2007-2024 | 2007-2024 | Table 5.3.6. Real Private Fixed Investment by Type, Chained Dollars (A) (Q)
T50401  | 1930-2023 |    0-   0 | Table 5.4.1. Percent Change From Preceding Period in Real Private Fixed Investment in Structures by Type (A)
T50402  | 1930-2023 |    0-   0 | Table 5.4.2. Contributions to Percent Change in Real Private Fixed Investment in Structures by Type (A)
T50403  | 1929-2023 |    0-   0 | Table 5.4.3. Real Private Fixed Investment in Structures by Type, Quantity Indexes (A)
T50404  | 1929-2023 |    0-   0 | Table 5.4.4. Price Indexes for Private Fixed Investment in Structures by Type (A)
T50405  | 1929-2023 |    0-   0 | Table 5.4.5. Private Fixed Investment in Structures by Type (A)
T50406  | 2007-2023 |    0-   0 | Table 5.4.6. Real Private Fixed Investment in Structures by Type, Chained Dollars (A)
T50501  | 1930-2023 |    0-   0 | Table 5.5.1. Percent Change From Preceding Period in Real Private Fixed Investment in Equipment by Type (A)
T50502  | 1930-2023 |    0-   0 | Table 5.5.2. Contributions to Percent Change in Real Private Fixed Investment in Equipment by Type (A)
T50503  | 1929-2023 |    0-   0 | Table 5.5.3. Real Private Fixed Investment in Equipment by Type, Quantity Indexes (A)
T50504  | 1929-2023 |    0-   0 | Table 5.5.4. Price Indexes for Private Fixed Investment in Equipment by Type (A)
T50505  | 1929-2023 |    0-   0 | Table 5.5.5. Private Fixed Investment in Equipment by Type (A)
T50506  | 2007-2023 |    0-   0 | Table 5.5.6. Real Private Fixed Investment in Equipment by Type, Chained Dollars (A)
T50601  | 1930-2023 |    0-   0 | Table 5.6.1. Percent Change From Preceding Period in Real Private Fixed Investment in Intellectual Property Products by Type (A)
T50602  | 1930-2023 |    0-   0 | Table 5.6.2. Contributions to Percent Change in Private Fixed Investment in Intellectual Property Products by Type (A)
T50603  | 1929-2023 |    0-   0 | Table 5.6.3. Real Private Fixed Investment in Intellectual Property Products by Type, Quantity Indexes (A)
T50604  | 1929-2023 |    0-   0 | Table 5.6.4. Price Indexes for Private Fixed Investment in Intellectual Property Products by Type (A)
T50605  | 1929-2023 |    0-   0 | Table 5.6.5. Private Fixed Investment in Intellectual Property Products by Type (A)
T50606  | 2007-2023 |    0-   0 | Table 5.6.6. Real Private Fixed Investment in Intellectual Property Products by Type, Chained Dollars (A)
T50705A | 1929-1997 | 1947-1997 | Table 5.7.5A. Change in Private Inventories by Industry (A) (Q)
T50705B | 1997-2024 | 1997-2024 | Table 5.7.5B. Change in Private Inventories by Industry (A) (Q)
T50706A | 1929-1997 | 1947-1997 | Table 5.7.6A. Change in Real Private Inventories by Industry, Chained Dollars (A) (Q)
T50706B | 1997-2024 | 1997-2024 | Table 5.7.6B. Change in Real Private Inventories by Industry, Chained Dollars (A) (Q)
T50805A |    0-   0 | 1947-1997 | Table 5.8.5A. Private Inventories and Domestic Final Sales of Business by Industry (Q)
T50805B |    0-   0 | 1996-2024 | Table 5.8.5B. Private Inventories and Domestic Final Sales by Industry (Q)
T50806A |    0-   0 | 1947-1997 | Table 5.8.6A. Real Private Inventories and Real Domestic Final Sales of Business by Industry, Chained Dollars (Q)
T50806B |    0-   0 | 1996-2024 | Table 5.8.6B. Real Private Inventories and Real Domestic Final Sales by Industry, Chained Dollars (Q)
T50809A |    0-   0 | 1947-1997 | Table 5.8.9A. Implicit Price Deflators for Private Inventories by Industry (Q)
T50809B |    0-   0 | 1996-2024 | Table 5.8.9B. Implicit Price Deflators for Private Inventories by Industry (Q)
T50903  | 1929-2023 |    0-   0 | Table 5.9.3. Real Gross Government Fixed Investment by Type, Quantity Indexes (A)
T50904  | 1929-2023 |    0-   0 | Table 5.9.4. Price Indexes for Gross Government Fixed Investment by Type (A)
T50905  | 1929-2023 |    0-   0 | Table 5.9.5. Gross Government Fixed Investment by Type (A)
T50906  | 2007-2023 |    0-   0 | Table 5.9.6. Real Gross Government Fixed Investment by Type, Chained Dollars (A)
T51000  | 1951-2023 |    0-   0 | Table 5.10. Changes in Net Stock of Produced Assets (Fixed Assets and Inventories) (A)
T51100  | 1929-2023 |    0-   0 | Table 5.11. Capital Transfers Paid and Received, by Sector and by Type (A)
T60100B | 1948-1987 | 1948-1987 | Table 6.1B. National Income Without Capital Consumption Adjustment by Industry (A) (Q)
T60100C | 1987-2000 | 1987-2000 | Table 6.1C. National Income Without Capital Consumption Adjustment by Industry (A) (Q)
T60100D | 1998-2024 | 2001-2024 | Table 6.1D. National Income Without Capital Consumption Adjustment by Industry (A) (Q)
T60200A | 1929-1948 |    0-   0 | Table 6.2A. Compensation of Employees by Industry (A)
T60200B | 1948-1987 |    0-   0 | Table 6.2B. Compensation of Employees by Industry (A)
T60200C | 1987-2000 |    0-   0 | Table 6.2C. Compensation of Employees by Industry (A)
T60200D | 1998-2023 |    0-   0 | Table 6.2D. Compensation of Employees by Industry (A)
T60300A | 1929-1948 |    0-   0 | Table 6.3A. Wages and Salaries by Industry (A)
T60300B | 1948-1987 |    0-   0 | Table 6.3B. Wages and Salaries by Industry (A)
T60300C | 1987-2000 |    0-   0 | Table 6.3C. Wages and Salaries by Industry (A)
T60300D | 1998-2023 |    0-   0 | Table 6.3D. Wages and Salaries by Industry (A)
T60400A | 1929-1948 |    0-   0 | Table 6.4A. Full-Time and Part-Time Employees by Industry (A)
T60400B | 1948-1987 |    0-   0 | Table 6.4B. Full-Time and Part-Time Employees by Industry (A)
T60400C | 1987-2000 |    0-   0 | Table 6.4C. Full-Time and Part-Time Employees by Industry (A)
T60400D | 1998-2023 |    0-   0 | Table 6.4D. Full-Time and Part-Time Employees by Industry (A)
T60500A | 1929-1948 |    0-   0 | Table 6.5A. Full-Time Equivalent Employees by Industry (A)
T60500B | 1948-1987 |    0-   0 | Table 6.5B. Full-Time Equivalent Employees by Industry (A)
T60500C | 1987-2000 |    0-   0 | Table 6.5C. Full-Time Equivalent Employees by Industry (A)
T60500D | 1998-2023 |    0-   0 | Table 6.5D. Full-Time Equivalent Employees by Industry (A)
T60600A | 1929-1948 |    0-   0 | Table 6.6A. Wages and Salaries Per Full-Time Equivalent Employee by Industry (A)
T60600B | 1948-1987 |    0-   0 | Table 6.6B. Wages and Salaries Per Full-Time Equivalent Employee by Industry (A)
T60600C | 1987-2000 |    0-   0 | Table 6.6C. Wages and Salaries Per Full-Time Equivalent Employee by Industry (A)
T60600D | 1998-2023 |    0-   0 | Table 6.6D. Wages and Salaries Per Full-Time Equivalent Employee by Industry (A)
T61000B | 1948-1987 |    0-   0 | Table 6.10B. Employer Contributions for Government Social Insurance by Industry (A)
T61000C | 1987-2000 |    0-   0 | Table 6.10C. Employer Contributions for Government Social Insurance by Industry (A)
T61000D | 1998-2023 |    0-   0 | Table 6.10D. Employer Contributions for Government Social Insurance by Industry (A)
T61100A | 1929-1947 |    0-   0 | Table 6.11A. Employer Contributions for Employee Pension and Insurance Funds by Industry and by Type (A)
T61100B | 1948-1987 |    0-   0 | Table 6.11B. Employer Contributions for Employee Pension and Insurance Funds by Industry and by Type (A)
T61100C | 1987-2000 |    0-   0 | Table 6.11C. Employer Contributions for Employee Pension and Insurance Funds by Industry and by Type (A)
T61100D | 1998-2023 |    0-   0 | Table 6.11D. Employer Contributions for Employee Pension and Insurance Funds by Industry and by Type (A)
T61200A | 1929-1948 |    0-   0 | Table 6.12A. Nonfarm Proprietors' Income by Industry (A)
T61200B | 1948-1987 |    0-   0 | Table 6.12B. Nonfarm Proprietors' Income by Industry (A)
T61200C | 1987-2000 |    0-   0 | Table 6.12C. Nonfarm Proprietors' Income by Industry (A)
T61200D | 1998-2023 |    0-   0 | Table 6.12D. Nonfarm Proprietors' Income by Industry (A)
T61300A | 1929-1947 |    0-   0 | Table 6.13A. Noncorporate Capital Consumption Allowances by Industry (A)
T61300B | 1948-1987 |    0-   0 | Table 6.13B. Noncorporate Capital Consumption Allowances by Industry (A)
T61300C | 1987-2000 |    0-   0 | Table 6.13C. Noncorporate Capital Consumption Allowances by Industry (A)
T61300D | 1998-2023 |    0-   0 | Table 6.13D. Noncorporate Capital Consumption Allowances by Industry (A)
T61400A | 1929-1947 |    0-   0 | Table 6.14A. Inventory Valuation Adjustment to Nonfarm Incomes by Legal Form of Organization and by Industry (A)
T61400B | 1948-1987 |    0-   0 | Table 6.14B. Inventory Valuation Adjustment to Nonfarm Incomes by Legal Form of Organization and by Industry (A)
T61400C | 1987-2000 |    0-   0 | Table 6.14C. Inventory Valuation Adjustment to Nonfarm Incomes by Legal Form of Organization and by Industry (A)
T61400D | 1998-2023 |    0-   0 | Table 6.14D. Inventory Valuation Adjustment to Nonfarm Incomes by Legal Form of Organization and by Industry (A)
T61500A | 1929-1947 |    0-   0 | Table 6.15A. Net Interest by Industry (A)
T61500B | 1948-1987 |    0-   0 | Table 6.15B. Net Interest by Industry (A)
T61500C | 1987-2000 |    0-   0 | Table 6.15C. Net Interest by Industry (A)
T61500D | 1998-2023 |    0-   0 | Table 6.15D. Net Interest by Industry (A)
T61600A | 1929-1947 |    0-   0 | Table 6.16A. Corporate Profits by Industry (A)
T61600B | 1948-1987 | 1948-1987 | Table 6.16B. Corporate Profits by Industry (A) (Q)
T61600C | 1987-2000 | 1987-2000 | Table 6.16C. Corporate Profits by Industry (A) (Q)
T61600D | 1998-2024 | 2001-2024 | Table 6.16D. Corporate Profits by Industry (A) (Q)
T61700A | 1929-1948 |    0-   0 | Table 6.17A. Corporate Profits Before Tax by Industry (A)
T61700B | 1948-1987 |    0-   0 | Table 6.17B. Corporate Profits Before Tax by Industry (A)
T61700C | 1987-2000 |    0-   0 | Table 6.17C. Corporate Profits Before Tax by Industry (A)
T61700D | 1998-2023 |    0-   0 | Table 6.17D. Corporate Profits Before Tax by Industry (A)
T61800A | 1929-1947 |    0-   0 | Table 6.18A. Taxes on Corporate Income by Industry (A)
T61800B | 1948-1987 |    0-   0 | Table 6.18B. Taxes on Corporate Income by Industry (A)
T61800C | 1987-2000 |    0-   0 | Table 6.18C. Taxes on Corporate Income by Industry (A)
T61800D | 1998-2023 |    0-   0 | Table 6.18D. Taxes on Corporate Income by Industry (A)
T61900A | 1929-1947 |    0-   0 | Table 6.19A. Corporate Profits After Tax by Industry (A)
T61900B | 1948-1987 |    0-   0 | Table 6.19B. Corporate Profits After Tax by Industry (A)
T61900C | 1987-2000 |    0-   0 | Table 6.19C. Corporate Profits After Tax by Industry (A)
T61900D | 1998-2023 |    0-   0 | Table 6.19D. Corporate Profits After Tax by Industry (A)
T62000A | 1929-1947 |    0-   0 | Table 6.20A. Net Corporate Dividend Payments by Industry (A)
T62000B | 1948-1987 |    0-   0 | Table 6.20B. Net Corporate Dividend Payments by Industry (A)
T62000C | 1987-2000 |    0-   0 | Table 6.20C. Net Corporate Dividend Payments by Industry (A)
T62000D | 1998-2023 |    0-   0 | Table 6.20D. Net Corporate Dividend Payments by Industry (A)
T62100A | 1929-1947 |    0-   0 | Table 6.21A. Undistributed Corporate Profits by Industry (A)
T62100B | 1948-1987 |    0-   0 | Table 6.21B. Undistributed Corporate Profits by Industry (A)
T62100C | 1987-2000 |    0-   0 | Table 6.21C. Undistributed Corporate Profits by Industry (A)
T62100D | 1998-2023 |    0-   0 | Table 6.21D. Undistributed Corporate Profits by Industry (A)
T62200A | 1929-1947 |    0-   0 | Table 6.22A. Corporate Capital Consumption Allowances by Industry (A)
T62200B | 1948-1987 |    0-   0 | Table 6.22B. Corporate Capital Consumption Allowances by Industry (A)
T62200C | 1987-2000 |    0-   0 | Table 6.22C. Corporate Capital Consumption Allowances by Industry (A)
T62200D | 1998-2023 |    0-   0 | Table 6.22D. Corporate Capital Consumption Allowances by Industry (A)
T70100  | 1929-2024 | 1947-2024 | Table 7.1. Selected Per Capita Product and Income Series in Current and Chained Dollars (A) (Q)
T70201A | 1948-1966 | 1947-1966 | Table 7.2.1A. Percent Change From Preceding Period in Real Auto Output (A) (Q)
T70201B | 1968-2024 | 1967-2024 | Table 7.2.1B. Percent Change From Preceding Period in Real Motor Vehicle Output (A) (Q)
T70203A | 1947-1966 | 1947-1966 | Table 7.2.3A. Real Auto Output, Quantity Indexes (A) (Q)
T70203B | 1967-2024 | 1967-2024 | Table 7.2.3B. Real Motor Vehicle Output, Quantity Indexes (A) (Q)
T70204A | 1947-1966 | 1947-1966 | Table 7.2.4A. Price Indexes for Auto Output (A) (Q)
T70204B | 1967-2024 | 1967-2024 | Table 7.2.4B. Price Indexes for Motor Vehicle Output (A) (Q)
T70205A | 1947-1966 | 1947-1966 | Table 7.2.5A. Auto Output (A) (Q)
T70205B | 1967-2024 | 1967-2024 | Table 7.2.5B. Motor Vehicle Output (A) (Q)
T70206B | 2007-2024 | 2007-2024 | Table 7.2.6B. Real Motor Vehicle Output, Chained Dollars (A) (Q)
T70303  | 1929-2023 |    0-   0 | Table 7.3.3. Real Farm Sector Output, Real Gross Value Added, and Real Net Value Added, Quantity Indexes (A)
T70304  | 1929-2023 |    0-   0 | Table 7.3.4. Price Indexes for Farm Sector Output, Gross Value Added, and Net Value Added (A)
T70305  | 1929-2023 |    0-   0 | Table 7.3.5. Farm Sector Output, Gross Value Added, and Net Value Added (A)
T70306  | 2007-2023 |    0-   0 | Table 7.3.6. Real Farm Sector Output, Real Gross Value Added, and Real Net Value Added, Chained Dollars (A)
T70403  | 1929-2023 |    0-   0 | Table 7.4.3. Real Housing Sector Output, Real Gross Value Added, and Real Net Value Added, Quantity Indexes (A)
T70404  | 1929-2023 |    0-   0 | Table 7.4.4. Price Indexes for Housing Sector Output, Gross Value Added, and Net Value Added (A)
T70405  | 1929-2023 |    0-   0 | Table 7.4.5. Housing Sector Output, Gross Value Added, and Net Value Added (A)
T70406  | 2007-2023 |    0-   0 | Table 7.4.6. Real Housing Sector Output, Real Gross Value Added, and Real Net Value Added, Chained Dollars (A)
T70500  | 1929-2024 | 1947-2024 | Table 7.5. Consumption of Fixed Capital by Legal Form of Organization and Type of Income (A) (Q)
T70600  | 1929-2023 |    0-   0 | Table 7.6. Capital Consumption Adjustment by Legal Form of Organization and Type of Adjustment (A)
T70700  | 1929-2023 |    0-   0 | Table 7.7. Business Current Transfer Payments by Type (A)
T70800  | 1948-2023 |    0-   0 | Table 7.8. Supplements to Wages and Salaries by Type (A)
T70900  | 1946-2023 |    0-   0 | Table 7.9. Rental Income of Persons by Legal Form of Organization and by Type of Income (A)
T71000  | 1946-2023 |    0-   0 | Table 7.10. Dividends Paid and Received by Sector (A)
T71100  | 1946-2023 |    0-   0 | Table 7.11. Interest Paid and Received by Sector and Legal Form of Organization (A)
T71300  | 1929-2023 |    0-   0 | Table 7.13. Relation of Consumption of Fixed Capital in the National Income and Product Accounts to Depreciation and Amortization as Published by the Internal Revenue Service (A)
T71400  | 1959-2023 |    0-   0 | Table 7.14. Relation of Nonfarm Proprietors' Income in the National Income and Product Accounts to Corresponding Measures as Published by the Internal Revenue Service (A)
T71500  | 1967-2023 |    0-   0 | Table 7.15. Relation of Net Farm Income in the National Income and Product Accounts to Net Farm Income as Published by the U.S. Department of Agriculture (A)
T71600  | 1929-2023 |    0-   0 | Table 7.16. Relation of Corporate Profits, Taxes, and Dividends in the National Income and Product Accounts to Corresponding Measures as Published by the Internal Revenue Service (A)
T71700  | 1946-2023 |    0-   0 | Table 7.17. Relation of Monetary Interest Paid and Received in the National Income and Product Accounts to Corresponding Measures as Published by the Internal Revenue Service (A)
T71800  | 1982-2023 |    0-   0 | Table 7.18. Relation of Wages and Salaries in the National Income and Product Accounts to Wages and Salaries as Published by the Bureau of Labor Statistics (A)
T71900  | 1992-2023 |    0-   0 | Table 7.19. Comparison of Income and Outlays of Nonprofit Institutions Serving Households with Revenue and Expenses as Published by the Internal Revenue Service (A)
T72000  | 1984-2023 |    0-   0 | Table 7.20. Transactions of Defined Benefit and Defined Contribution Pension Plans (A)
T72100  | 1984-2023 |    0-   0 | Table 7.21. Transactions of Defined Benefit Pension Plans (A)
T72200  | 1984-2023 |    0-   0 | Table 7.22. Transactions of Private Defined Benefit Pension Plans (A)
T72300  | 1929-2023 |    0-   0 | Table 7.23. Transactions of Federal Government Defined Benefit Pension Plans (A)
T72400  | 1929-2023 |    0-   0 | Table 7.24. Transactions of State and Local Government Defined Benefit Pension Plans (A)
T72500  | 1984-2023 |    0-   0 | Table 7.25. Transactions of Defined Contribution Pension Plans (A)
T80103  |    0-   0 | 2002-2024 | Table 8.1.3. Real Gross Domestic Product, Quantity Indexes, Not Seasonally Adjusted (Q)
T80104  |    0-   0 | 2002-2024 | Table 8.1.4. Price Indexes for Gross Domestic Product, Not Seasonally Adjusted (Q)
T80105  |    0-   0 | 1947-2024 | Table 8.1.5. Gross Domestic Product, Not Seasonally Adjusted (Q)
T80106  |    0-   0 | 2002-2024 | Table 8.1.6. Real Gross Domestic Product, Chained Dollars, Not Seasonally Adjusted (Q)
T80111  |    0-   0 | 2003-2024 | Table 8.1.11. Real Gross Domestic Product: Percent Change From Quarter One Year Ago, Not Seasonally Adjusted (Q)
T80200  |    0-   0 | 2002-2024 | Table 8.2. Gross Domestic Income by Type of Income, Not Seasonally Adjusted (Q)
T80300  |    0-   0 | 1947-2024 | Table 8.3. Federal Government Current Receipts and Expenditures, Not Seasonally Adjusted (Q)
T80400  |    0-   0 | 1947-2024 | Table 8.4. State and Local Government Current Receipts and Expenditures, Not Seasonally Adjusted (Q)
From the table printed above, we see that table T60300D has annual data from 1998 to 2023 for “Wages and Salaries by Industry.” Below, we use the GetData method to retrieve the annual data from this table for every available year:
params = {
    'method': 'GetData',
    'datasetname': 'NIPA',
    'Frequency': 'A',       # Annual data
    'TableName': 'T60300D', # Wages and Salaries by Industry
    'year': 'X',            # Data for 1998-2022
    'UserID': USERID
}
data = requests.get(BASE_URL, params=params).json()

# Display size of data [number of industries (99) x number of years (25)]
len(data['BEAAPI']['Results']['Data'])
2574
data['BEAAPI']['Results']['Data'][:3]
[{'TableName': 'T60300D',
  'SeriesCode': 'A034RC',
  'LineNumber': '1',
  'LineDescription': 'Wages and salaries',
  'TimePeriod': '1998',
  'METRIC_NAME': 'Current Dollars',
  'CL_UNIT': 'Level',
  'UNIT_MULT': '6',
  'DataValue': '4,181,616',
  'NoteRef': 'T60300D'},
 {'TableName': 'T60300D',
  'SeriesCode': 'A034RC',
  'LineNumber': '1',
  'LineDescription': 'Wages and salaries',
  'TimePeriod': '1999',
  'METRIC_NAME': 'Current Dollars',
  'CL_UNIT': 'Level',
  'UNIT_MULT': '6',
  'DataValue': '4,457,926',
  'NoteRef': 'T60300D'},
 {'TableName': 'T60300D',
  'SeriesCode': 'A034RC',
  'LineNumber': '1',
  'LineDescription': 'Wages and salaries',
  'TimePeriod': '2000',
  'METRIC_NAME': 'Current Dollars',
  'CL_UNIT': 'Level',
  'UNIT_MULT': '6',
  'DataValue': '4,824,946',
  'NoteRef': 'T60300D'}]
industries = [
    'Agriculture, forestry, fishing, and hunting', 'Mining', 'Utilities', 'Construction',
    'Manufacturing', 'Wholesale trade', 'Retail trade', 'Transportation and warehousing',
    'Information', 'Finance and insurance', 'Real estate and rental and leasing',
    'Professional, scientific, and technical services',
    'Management of companies and enterprises', 'Administrative and waste management services',
    'Educational services', 'Health care and social assistance',
    'Arts, entertainment, and recreation', 'Accommodation and food services',
    'Other services, except government', 'Government'
]

data_by_industry = []
for industry in industries:
    years_values = []
    for item in data['BEAAPI']['Results']['Data']:
        if item['LineDescription'] == industry:
            year = int(item['TimePeriod'])
            value = int(item['DataValue'].replace(',', ''))
            value /= 1000   # Convert value to billions
            years_values.append((year, value))
    data_by_industry.append((industry, years_values))

# Display length of results (number of years)
len(data_by_industry)
20
fig, axs = plt.subplots(5, 4, figsize=(17.5, 14), sharex=True)
fig.suptitle('Total Wages and Salaries (in Billion USD) by Industry 1998-2022')

for i in range(20):
    x = i // 4  # x-coordinate of graph (row number)
    y = i % 4   # y-coordinate of graph (column number)

    industry_name = data_by_industry[i][0]
    years, values = zip(*data_by_industry[i][1])

    axs[x, y].scatter(years, values, s=8, color='darkgreen')
    axs[x, y].set_title(industry_name)
    axs[x, y].grid(linewidth=0.5, color='lightgray')
    axs[x, y].set_axisbelow(True)

plt.tight_layout()
plt.show()
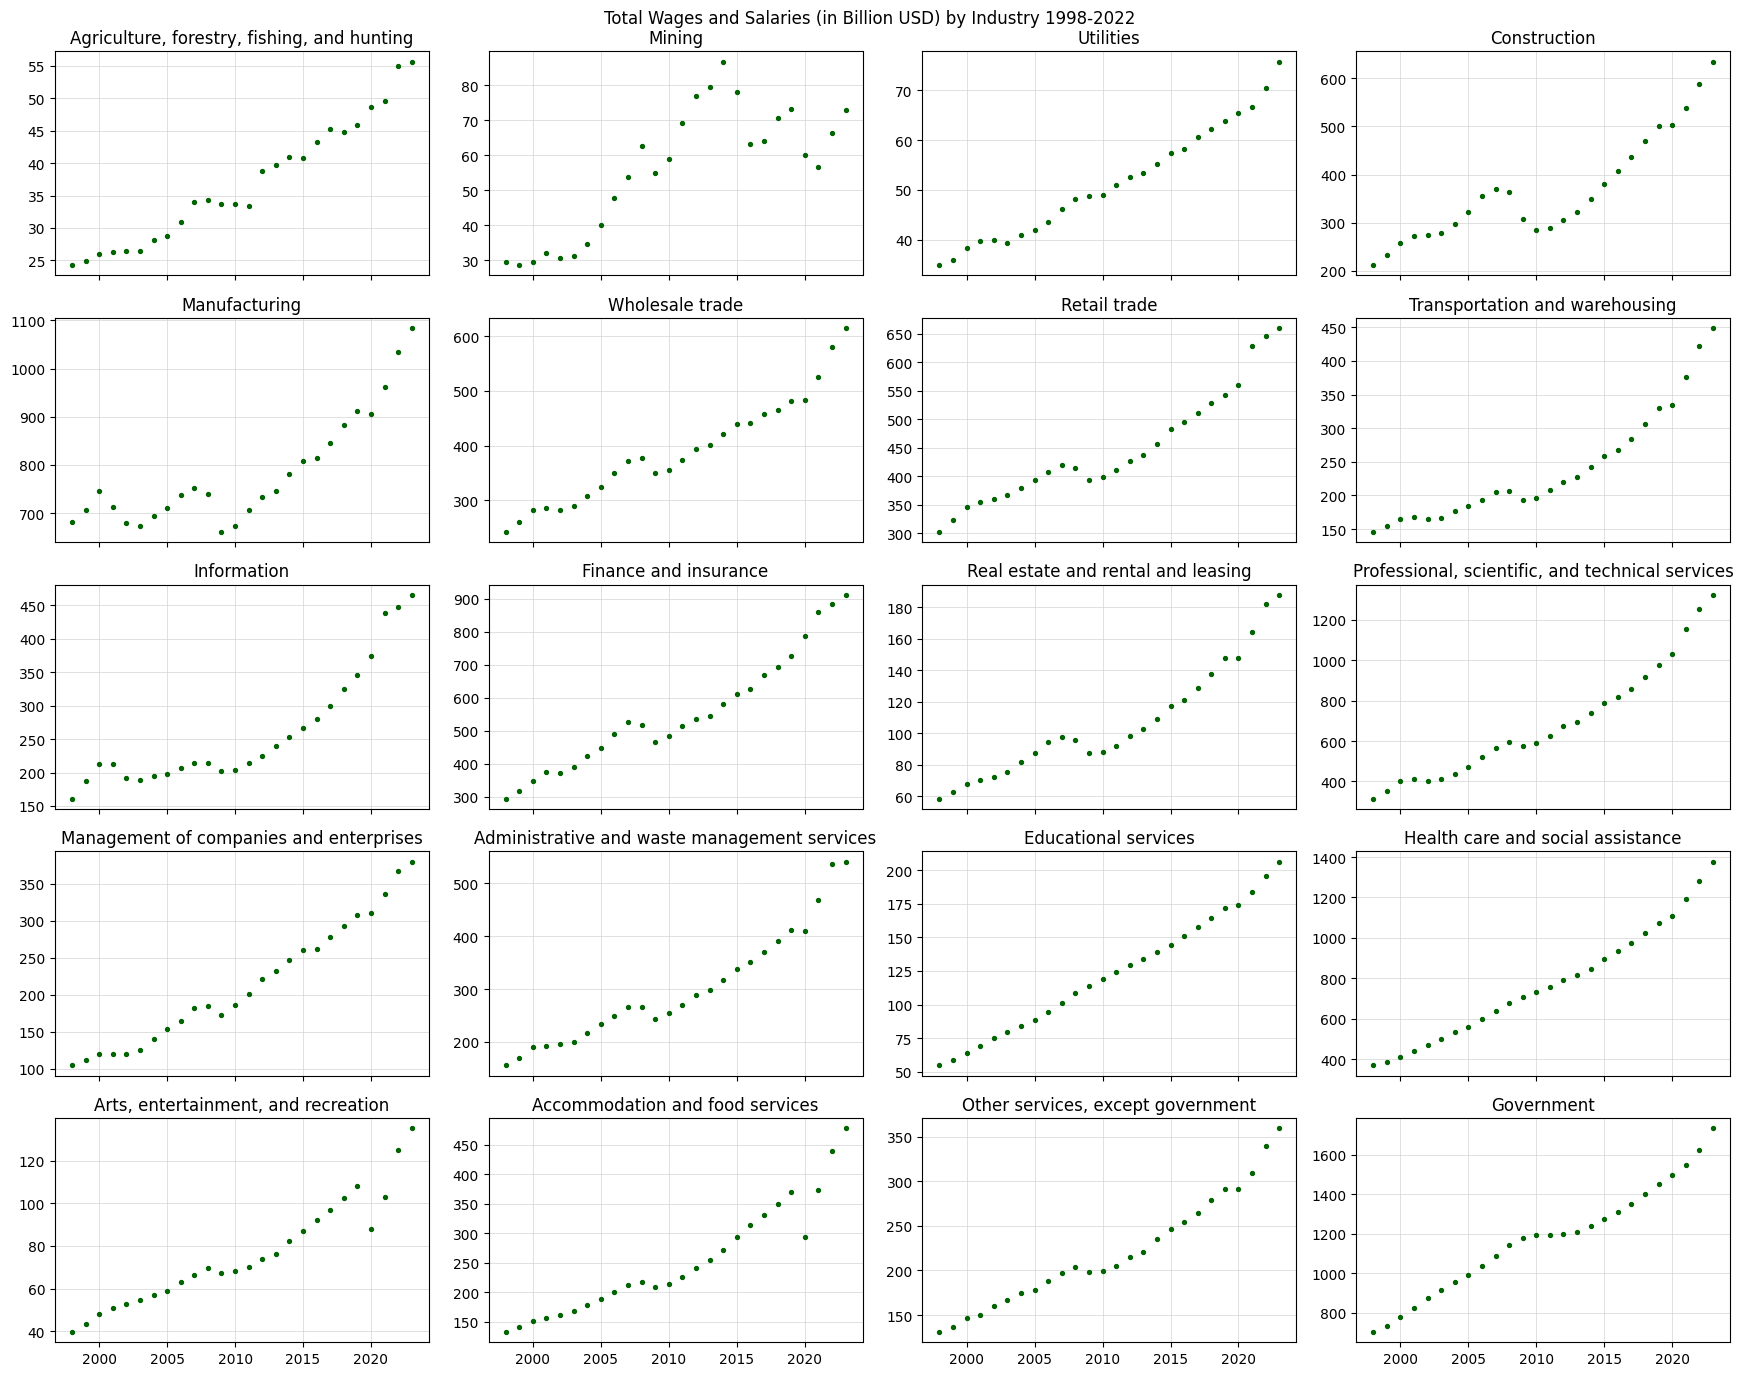
Note that the graphs below are not scaled together. Please check the y-axis labels to see the individual scales for each graph.