World Bank API in Python#
by Avery Fernandez and Michael T. Moen
The World Bank offers a suite of APIs providing access to a vast array of global development data, including economic indicators, project information, and more. These APIs enable users to programmatically retrieve data for analysis, application development, and research purposes.
Please see the following resources for more information on API usage:
Documentation
Terms
Data Reuse
NOTE: Please see access details and rate limit requests for this API in the official documentation.
These recipe examples were tested on March 10, 2026.
Setup#
Import Libraries#
The following external libraries need to be installed into your environment to run the code examples in this tutorial:
We import the libraries used in this tutorial below:
import matplotlib.pyplot as plt
import pandas as pd
import plotly.express as px
import pycountry
import requests
from time import sleep
DataBank Bulk Download#
The World Bank offers bulk downloads of specific datasets from DataBank Bulk Download or DataBank Bulk Microdata Download. If you require extensive or complete data, consider using these bulk downloads. For smaller requests or interactive analysis, the standard API calls work well.
1. Comparing GDP per Capita by Country#
In this example, we look at the GDP per capita of each country using the NY.GDP.PCAP.CD indicator. Note we examine both countries and dependent territories defined as having ISO 3166-1 alpha-3 (also known here as ISO 3) codes.
BASE_URL = "http://api.worldbank.org/v2/country/all/indicator"
indicator = "NY.GDP.PCAP.CD"    # Indicator code for GDP per capita (current USD)

params = {
    "date": 2024,
    "format": "json",
    "per_page": 500,
}
response = requests.get(f"{BASE_URL}/{indicator}", params=params)

# Status code 200 indicates success
response
<Response [200]>
# Extract JSON data from response
data = response.json()[1]

# Print first result
data[0]
{'indicator': {'id': 'NY.GDP.PCAP.CD',
  'value': 'GDP per capita (current US$)'},
 'country': {'id': 'ZH', 'value': 'Africa Eastern and Southern'},
 'countryiso3code': 'AFE',
 'date': '2024',
 'value': 1615.39635562849,
 'unit': '',
 'obs_status': '',
 'decimal': 1}
# Convert result to a pandas DataFrame and drop unnecessary columns
df = pd.DataFrame(data)
df = df.drop(columns=["country", "indicator", "unit", "obs_status", "decimal"])

df.head()
| countryiso3code | date | value | |
|---|---|---|---|
| 0 | AFE | 2024 | 1615.396356 |
| 1 | AFW | 2024 | 1411.337029 |
| 2 | ARB | 2024 | 7583.811701 |
| 3 | CSS | 2024 | 19903.811231 |
| 4 | CEB | 2024 | 24604.806860 |
Below, we use the pycountry package to retrieve the names of te countries based on their ISO 3 codes. Since the World Bank also maintains listings for different aggregations, we also drop those from the data below:
def iso3_to_country(code):
    country = pycountry.countries.get(alpha_3=code)
    return country.name if country else None

df["country_name"] = df["countryiso3code"].apply(iso3_to_country)

# World Bank contains some aggregate regions (e.g., "World", "High income") that aren't
# officially defined countries, so we drop those rows
df = df.dropna(subset=["country_name"])
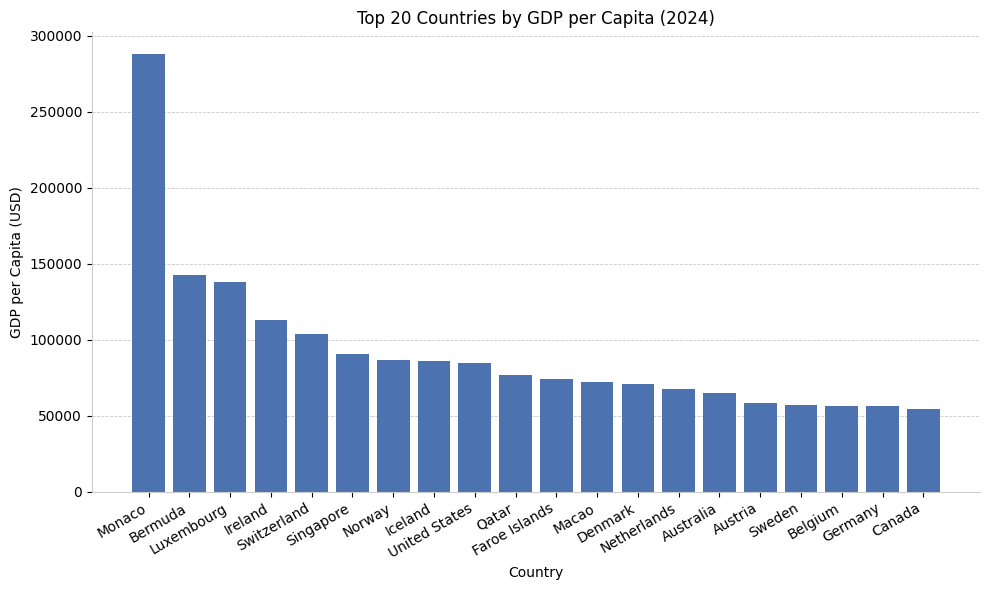
# Extract top 20 countries by GDP per capita
top20 = df.sort_values("value", ascending=False).head(20)

# Print top 20 countries
top20
| countryiso3code | date | value | country_name | |
|---|---|---|---|---|
| 179 | MCO | 2024 | 288001.433369 | Monaco |
| 70 | BMU | 2024 | 142855.374714 | Bermuda |
| 165 | LUX | 2024 | 137781.681659 | Luxembourg |
| 142 | IRL | 2024 | 112894.953241 | Ireland |
| 237 | CHE | 2024 | 103998.186686 | Switzerland |
| 220 | SGP | 2024 | 90674.066633 | Singapore |
| 196 | NOR | 2024 | 86785.433449 | Norway |
| 137 | ISL | 2024 | 86040.530985 | Iceland |
| 255 | USA | 2024 | 84534.040784 | United States |
| 208 | QAT | 2024 | 76688.694174 | Qatar |
| 114 | FRO | 2024 | 74119.660755 | Faroe Islands |
| 166 | MAC | 2024 | 72004.743702 | Macao |
| 102 | DNK | 2024 | 71026.483227 | Denmark |
| 188 | NLD | 2024 | 67520.421896 | Netherlands |
| 59 | AUS | 2024 | 64603.985631 | Australia |
| 60 | AUT | 2024 | 58268.878765 | Austria |
| 236 | SWE | 2024 | 57117.487744 | Sweden |
| 67 | BEL | 2024 | 56614.567950 | Belgium |
| 122 | DEU | 2024 | 56103.732318 | Germany |
| 84 | CAN | 2024 | 54340.347722 | Canada |
fig, ax = plt.subplots(figsize=(10,6))

# Bars
ax.bar(top20["country_name"], top20["value"], color="#4C72B0")

# Gridlines
ax.grid(axis="y", linestyle="--", linewidth=0.6, alpha=0.7)
ax.set_axisbelow(True)

# Remove top/right spines
ax.spines["top"].set_visible(False)
ax.spines["right"].set_visible(False)

# Lighten remaining spines
ax.spines["left"].set_color("#CCCCCC")
ax.spines["bottom"].set_color("#CCCCCC")

# Labels and title
ax.set_title("Top 20 Countries by GDP per Capita (2024)")
ax.set_xlabel("Country")
ax.set_ylabel("GDP per Capita (USD)")

# Rotate country labels
plt.xticks(rotation=30, ha="right")

plt.tight_layout()
plt.show()
2. Comparing Scientific and Technical Journal Articles by Country#
In this example, we look at the “scientific and technical journal articles” of each country using the IP.JRN.ARTC.SC indicator and the total population of each country using the SP.POP.TOTL. Note we examine both countries and dependent territories defined as having ISO 3166-1 alpha-3 (also known here as ISO 3) codes.
BASE_URL = "https://api.worldbank.org/v2/country/all/indicator"
indicators = {
    "IP.JRN.ARTC.SC": "Article Count",
    "SP.POP.TOTL": "Population"
}

params = {
    "date": 2021,
    "format": "json",
    "per_page": 500
}

dfs = []
for indicator, colname in indicators.items():
    response = requests.get(f"{BASE_URL}/{indicator}", params=params)

    df_temp = pd.DataFrame(response.json()[1])

    df_temp = df_temp[["countryiso3code", "value"]]
    df_temp = df_temp.rename(columns={"value": colname})

    dfs.append(df_temp)

# Merge both datasets
df = dfs[0].merge(dfs[1], on="countryiso3code")

# Add country names
df["Country Name"] = df["countryiso3code"].apply(iso3_to_country)

# Remove aggregates like "World", "High income", etc.
df = df.dropna(subset=["Country Name"])

df.head()
| countryiso3code | Article Count | Population | Country Name | |
|---|---|---|---|---|
| 69 | AFG | 177.39 | 40000412.0 | Afghanistan |
| 70 | ALB | 241.09 | 2489762.0 | Albania |
| 71 | DZA | 6839.00 | 44761099.0 | Algeria |
| 72 | ASM | NaN | 49225.0 | American Samoa |
| 73 | AND | 9.44 | 78364.0 | Andorra |
# Calculate article count per million people
df["Article Count per Million"] = df["Article Count"] / df["Population"] * 1000000

df.head()
| countryiso3code | Article Count | Population | Country Name | Article Count per Million | |
|---|---|---|---|---|---|
| 69 | AFG | 177.39 | 40000412.0 | Afghanistan | 4.434704 |
| 70 | ALB | 241.09 | 2489762.0 | Albania | 96.832549 |
| 71 | DZA | 6839.00 | 44761099.0 | Algeria | 152.788921 |
| 72 | ASM | NaN | 49225.0 | American Samoa | NaN |
| 73 | AND | 9.44 | 78364.0 | Andorra | 120.463478 |
# Use Plotly to create an interactive choropleth map
fig = px.choropleth(
    df,
    locations="countryiso3code",
    color="Article Count per Million",
    hover_name="Country Name",
    hover_data={
        "Article Count per Million": True,
        "Article Count": True,
        "Population": True,
        "countryiso3code": False
    },
    color_continuous_scale="viridis",
    projection="natural earth",
    title="Technical Journal Articles by Country (2021)"
)

fig.show()